Tiwala Lhungz Company Tiwala Lhung Company Balance Sheet Income Statement As of December 31, 2016 Forthe yearended December 31, 2016 2016 2015 2016 2015 Assets Net Sales P8,000,000.00 P6,500,000.0 5,000,000.00 3,000, 000. 00 1,300,000. 00 1,700, 000.00 50,000.00 1,650,000.00 660,000.00 Current Assets: Less: Cost of Goods Sold 4,000,000.0 2,500,000.0 Cash P2,800,000.00 2,500,000 Gross Margin Less: Operating Expenses Marketable Securities 800,000.00 700,000.00 1,000,000.0 1,500,000.0 Accounts Receivable (net) 900,000.00 490,000.00 93,000.00 5,083,000.00 900,000.00 260,000.00 74,000.00 4,434,000.00 Operati ng Income Less:Interest Expense Inventories 50,000.0 1,450,000.0 580,000.0 Other Current Assets Interest before taxes Total Current Assets Less: Income Tax Non-Current Assets: NetIncome 990,000.00 870,000.0 1, 500, 000.00 1,340,000.00 1, 500,000.00 1,150,000.00 2,650,000.00 7,084,000.00 Land Analyze using: A. Horizontal Analysis B. Vertical Analysis Building (net) Total Non-Current Assets 2,840,000.00 7,923,000.00 Total Assets C. Ratio Analysis 1. Return on Sales Liabilities and Stockholder's Equity Current Liabilities: 2. Return on Assets Accounts Payable Notes Payable Accrued payables 3. Average Total Assets 4. Average Common Stockholder's Equity 5. Return on Stockholder's Equity 6. Earnings per share 7. Price-Earnings Ratio 290,000.00 1, 100,000.00 101,500.00 540,000.00 200,000.00 57,000.00 698,500.00 Total Current Liabilities 1,590,000.00 Non-Current Liabilities: Bonds Payable, 10% 50,000. 00 50,000.00 1,640, 000.00 8. Current Ratio 9. Quick Ratio Total Liabilities 748,500.00 Stockholder's Equity: Common Stock, P1.50 par 10. Accounts Receivable Turn-over Ratio 3,000, 000.00 3,000,000.00 2,000,000.00 11. Average Accounts Receivable 12. Average Age of Receivable Additional Paid-in Capital Retained Earnings Total Stockholder's Equity Total Liabilities and Stockholder's Equity 2,000,000.00 1,283,000.00 1,335,500.00 13. Inventory Turn-ove Ratio 14. Average Inventory 15. Average age of inventories 6,283,000.00 6,335,500.00 7,084,000.00 7,923,000.00 16. Times interest Earned Ratio 17. Debt Ratio 18 Deht-to-equity Ratio
Tiwala Lhungz Company Tiwala Lhung Company Balance Sheet Income Statement As of December 31, 2016 Forthe yearended December 31, 2016 2016 2015 2016 2015 Assets Net Sales P8,000,000.00 P6,500,000.0 5,000,000.00 3,000, 000. 00 1,300,000. 00 1,700, 000.00 50,000.00 1,650,000.00 660,000.00 Current Assets: Less: Cost of Goods Sold 4,000,000.0 2,500,000.0 Cash P2,800,000.00 2,500,000 Gross Margin Less: Operating Expenses Marketable Securities 800,000.00 700,000.00 1,000,000.0 1,500,000.0 Accounts Receivable (net) 900,000.00 490,000.00 93,000.00 5,083,000.00 900,000.00 260,000.00 74,000.00 4,434,000.00 Operati ng Income Less:Interest Expense Inventories 50,000.0 1,450,000.0 580,000.0 Other Current Assets Interest before taxes Total Current Assets Less: Income Tax Non-Current Assets: NetIncome 990,000.00 870,000.0 1, 500, 000.00 1,340,000.00 1, 500,000.00 1,150,000.00 2,650,000.00 7,084,000.00 Land Analyze using: A. Horizontal Analysis B. Vertical Analysis Building (net) Total Non-Current Assets 2,840,000.00 7,923,000.00 Total Assets C. Ratio Analysis 1. Return on Sales Liabilities and Stockholder's Equity Current Liabilities: 2. Return on Assets Accounts Payable Notes Payable Accrued payables 3. Average Total Assets 4. Average Common Stockholder's Equity 5. Return on Stockholder's Equity 6. Earnings per share 7. Price-Earnings Ratio 290,000.00 1, 100,000.00 101,500.00 540,000.00 200,000.00 57,000.00 698,500.00 Total Current Liabilities 1,590,000.00 Non-Current Liabilities: Bonds Payable, 10% 50,000. 00 50,000.00 1,640, 000.00 8. Current Ratio 9. Quick Ratio Total Liabilities 748,500.00 Stockholder's Equity: Common Stock, P1.50 par 10. Accounts Receivable Turn-over Ratio 3,000, 000.00 3,000,000.00 2,000,000.00 11. Average Accounts Receivable 12. Average Age of Receivable Additional Paid-in Capital Retained Earnings Total Stockholder's Equity Total Liabilities and Stockholder's Equity 2,000,000.00 1,283,000.00 1,335,500.00 13. Inventory Turn-ove Ratio 14. Average Inventory 15. Average age of inventories 6,283,000.00 6,335,500.00 7,084,000.00 7,923,000.00 16. Times interest Earned Ratio 17. Debt Ratio 18 Deht-to-equity Ratio

Financial & Managerial Accounting
13th Edition
ISBN:9781285866307
Author:Carl Warren, James M. Reeve, Jonathan Duchac
Publisher:Carl Warren, James M. Reeve, Jonathan Duchac
Chapter15: Financial Statement Analysis
Section: Chapter Questions
Problem 15.1APR: Horizontal analysis of income statement For 2016, Clapton Company reported a decline in net income....

Related questions
Question
100%
Requirements:
Prepare a Summary of Ratio Analysis
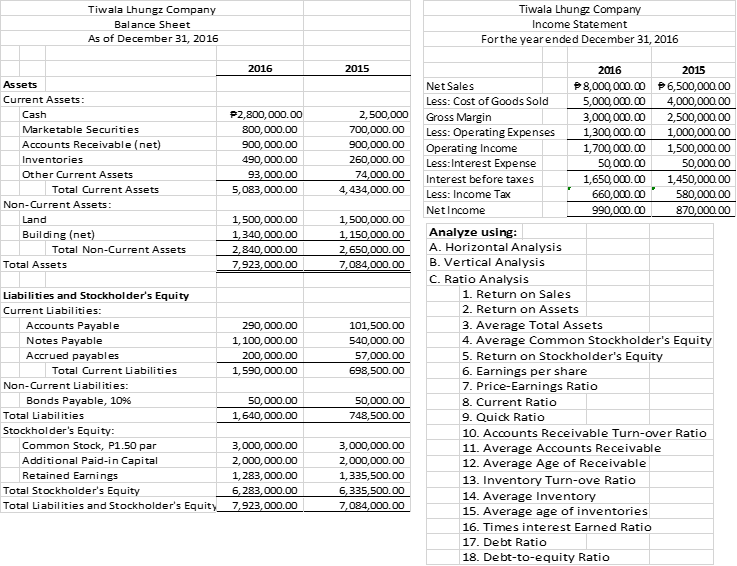
Transcribed Image Text:Tiwala Lhungz Company
Tiwala Lhung Company
Balance Sheet
Income Statement
As of December 31, 2016
Forthe yearended December 31, 2016
2016
2015
2016
2015
Assets
Net Sales
P8,000,000.00 P6,500,000.00
5,000,000.00
3,000,000.00
Current Assets:
Less: Cost of Goods Sold
4,000,000.00
2,500,000.00
Cash
P2,800,000.00
2,500,000
Gross Margin
Less: Operating Expenses
Marketable Securities
800,000.00
700,000.00
1,300,000.00
900,000.00
490, 000.00
1,000,000.00
1,500,000.00
Accounts Receivable (net)
900,000.00
Operating Income
Less:Interest Expense
1,700,000.00
50,000.00
1,650, 000.00
Inventories
260,000.00
50,000.00
1,450,000.00
580,000.00
Other Current Assets
93,000.00
5,083,000.00
74,000.00
Interest before taxes
Total Current Assets
4,434,000.00
Less: Income Tax
660,000.00
Non-Current Assets:
NetIncome
990,000.00
870,000.00
Land
1,500,000.00
1,500,000.00
Analyze using:
A. Horizontal Analysis
Building (net)
1,340,000.00
2,840,000.00
7,923,000.00
1,150,000.00
2,650,000.00
7,084,000.00
Total Non-Current Assets
Total Assets
B. Vertical Analysis
C. Ratio Analysis
Liabilities and Stockholder's Equity
1. Return on Sales
Current Liabilities:
2. Return on Assets
3. Average Total Assets
4. Average Common Stockholder's Equity
5. Return on Stockholder's Equity
Accounts Payable
290, 000.00
101,500.00
Notes Payable
1, 100,000.00
540,000.00
Accrued payables
200,000.00
57,000.00
Total Current Liabilities
1,590,000.00
698,500.00
6. Earnings per share
7. Price-Earnings Ratio
8. Current Ratio
9. Quick Ratio
Non-Current Liabilities:
Bonds Payable, 10%
50,000.00
50,000.00
Total Liabilities
1,640,000.00
748,500.00
Stockholder's Equity:
10. Accounts Receivable Turn-over Ratio
Common Stock, P1.50 par
3,000,000.00
3,000,000.00
11. Average Accounts Receivable
Additional Paid-in Capital
2,000,000.00
2,000,000.00
12. Average Age of Receivable
Retained Earnings
1,283,000.00
1,335,500.00
13. Inventory Turn-ove Ratio
Total Stockholder's Equity
6,283,000.00
7,923,000.00
6,335,500.00
14. Average Inventory
Total Liabilities and Stockholder's Equity
7,084,000.00
15. Average age of inventories
16. Times interest Earned Ratio
17. Debt Ratio
18. Debt-to-equity Ratio
Expert Solution
This question has been solved!
Explore an expertly crafted, step-by-step solution for a thorough understanding of key concepts.

Step by step
Solved in 2 steps with 1 images

Recommended textbooks for you
Financial & Managerial Accounting
Accounting
ISBN:
9781285866307
Author:
Carl Warren, James M. Reeve, Jonathan Duchac
Publisher:
Cengage Learning

Corporate Financial Accounting
Accounting
ISBN:
9781305653535
Author:
Carl Warren, James M. Reeve, Jonathan Duchac
Publisher:
Cengage Learning

Accounting (Text Only)
Accounting
ISBN:
9781285743615
Author:
Carl Warren, James M. Reeve, Jonathan Duchac
Publisher:
Cengage Learning
Financial & Managerial Accounting
Accounting
ISBN:
9781285866307
Author:
Carl Warren, James M. Reeve, Jonathan Duchac
Publisher:
Cengage Learning
Corporate Financial Accounting
Accounting
ISBN:
9781305653535
Author:
Carl Warren, James M. Reeve, Jonathan Duchac
Publisher:
Cengage Learning
Accounting (Text Only)
Accounting
ISBN:
9781285743615
Author:
Carl Warren, James M. Reeve, Jonathan Duchac
Publisher:
Cengage Learning

Fundamentals of Financial Management (MindTap Cou…
Finance
ISBN:
9781337395250
Author:
Eugene F. Brigham, Joel F. Houston
Publisher:
Cengage Learning


Cornerstones of Financial Accounting
Accounting
ISBN:
9781337690881
Author:
Jay Rich, Jeff Jones
Publisher:
Cengage Learning