2015-2019 Financial Statement Data and Stock Price Data for Mydeco Corp. (All data as of fiscal year end; in $ millions) Income Statement 2015 2016 2017 2018 2019 Revenue 402.1 362.8 421.7 506.8 599.2 Cost of Goods Sold (183.4) (170.1) (205.4) (248.4) (295.5) Gross Profit 218.7 192.7 216.3 258.4 303.7 Sales and Marketing (64.9) (62.3) (29.1) (83.2) (60.7) (34.7) (65.7) (105.1) (66.8) (39.1) (117.6) (79.8) (37.5) Administration (58.6) (28.5) Depreciation & Amortization EBIT 62.4 39.9 37.7 47.4 68.8 Interest Income (Expense) (33.8) (32.9) (33.9) (36.1) (41.3) Pretax Income 28.6 7.0 3.8 11.3 27.5 Income Tax (10.0) (2.5) (1.3) (4.0) (9.6) Net Income 18.6 4.5 2.5 7.3 17.9 Shares Outstanding (millions) Earnings per Share 56.8 56.8 56.8 56.8 56.8 $0.33 $0.08 $0.04 $0.13 $0.32 Balance Sheet 2015 2016 2017 2018 2019 Assets Cash 50.7 76.2 86.0 71.9 76.5 Accounts Receivable 87.5 70.5 70.9 76.1 86.8 32.2 35.9 199.2 Inventory 30.5 28.1 33.7 Total Current Assets 170.4 177.2 185.0 181.7 Net Property, Plant & Equipment Goodwill & Intangibles 246.1 239.8 305.8 350.2 347.2 362.4 362.4 362.4 362.4 362.4 Total Assets 778.9 779.4 853.2 894.3 908.8 Liabilities & Stockholders' Equity Accounts Payable Accrued Compensation 18.2 19.3 23.2 25.7 33.1 5.9 7.3 6.4 8.9 9.6 Total Current Liabilities 24.1 26.6 29.6 34.6 42.7 Long-Term Debt 504.4 504.4 581.1 606.8 606.8 Total Liabilities 528.5 531.0 610.7 641.4 649.5 Stockholders' Equity 250.4 248.4 242.5 252.9 259.3 Total Liabilities & Stockholders' Equity 778.9 779.4 853.2 894.3 908.8 Statement of Cash Flows 2015 2016 2017 2018 2019 Net Income 18.6 4.5 2.5 7.3 17.9 Depreciation & Amortization Change in Accounts Receivable Change in Inventory Change in Pay. & Accrued Comp. Cash from Operations Capital Expenditures Cash from Investing Activ. 29.1 28.5 34.7 39.1 37.5 3.9 - 0.4 (5.2) (5.6) (10.7) (2.2) 17.0 (2.9) 1.7 2.4 2.2 2.5 3.0 5.0 8.1 50.9 54.2 42.2 40.6 50.6 (24.5) (24.5) (4.9) (23.8) (23.8) (4.9) (104.2) (104.2) (4.9) (75.5) (75.5) (4.9) (38.7) (38.7) (7.3) Dividends Paid Sale (or Purchase) of Stock Debt Issuance (Pay Down) Cash from Financing Activ. Change in Cash Mydeco Stock Price 76.7 25.7 (4.9) (4.9) 71.8 20.8 (7.3) (14.1) $9.64 21.5 25.5 9.8 4.6 $7.91 $3.69 $6.23 $9.24
2015-2019 Financial Statement Data and Stock Price Data for Mydeco Corp. (All data as of fiscal year end; in $ millions) Income Statement 2015 2016 2017 2018 2019 Revenue 402.1 362.8 421.7 506.8 599.2 Cost of Goods Sold (183.4) (170.1) (205.4) (248.4) (295.5) Gross Profit 218.7 192.7 216.3 258.4 303.7 Sales and Marketing (64.9) (62.3) (29.1) (83.2) (60.7) (34.7) (65.7) (105.1) (66.8) (39.1) (117.6) (79.8) (37.5) Administration (58.6) (28.5) Depreciation & Amortization EBIT 62.4 39.9 37.7 47.4 68.8 Interest Income (Expense) (33.8) (32.9) (33.9) (36.1) (41.3) Pretax Income 28.6 7.0 3.8 11.3 27.5 Income Tax (10.0) (2.5) (1.3) (4.0) (9.6) Net Income 18.6 4.5 2.5 7.3 17.9 Shares Outstanding (millions) Earnings per Share 56.8 56.8 56.8 56.8 56.8 $0.33 $0.08 $0.04 $0.13 $0.32 Balance Sheet 2015 2016 2017 2018 2019 Assets Cash 50.7 76.2 86.0 71.9 76.5 Accounts Receivable 87.5 70.5 70.9 76.1 86.8 32.2 35.9 199.2 Inventory 30.5 28.1 33.7 Total Current Assets 170.4 177.2 185.0 181.7 Net Property, Plant & Equipment Goodwill & Intangibles 246.1 239.8 305.8 350.2 347.2 362.4 362.4 362.4 362.4 362.4 Total Assets 778.9 779.4 853.2 894.3 908.8 Liabilities & Stockholders' Equity Accounts Payable Accrued Compensation 18.2 19.3 23.2 25.7 33.1 5.9 7.3 6.4 8.9 9.6 Total Current Liabilities 24.1 26.6 29.6 34.6 42.7 Long-Term Debt 504.4 504.4 581.1 606.8 606.8 Total Liabilities 528.5 531.0 610.7 641.4 649.5 Stockholders' Equity 250.4 248.4 242.5 252.9 259.3 Total Liabilities & Stockholders' Equity 778.9 779.4 853.2 894.3 908.8 Statement of Cash Flows 2015 2016 2017 2018 2019 Net Income 18.6 4.5 2.5 7.3 17.9 Depreciation & Amortization Change in Accounts Receivable Change in Inventory Change in Pay. & Accrued Comp. Cash from Operations Capital Expenditures Cash from Investing Activ. 29.1 28.5 34.7 39.1 37.5 3.9 - 0.4 (5.2) (5.6) (10.7) (2.2) 17.0 (2.9) 1.7 2.4 2.2 2.5 3.0 5.0 8.1 50.9 54.2 42.2 40.6 50.6 (24.5) (24.5) (4.9) (23.8) (23.8) (4.9) (104.2) (104.2) (4.9) (75.5) (75.5) (4.9) (38.7) (38.7) (7.3) Dividends Paid Sale (or Purchase) of Stock Debt Issuance (Pay Down) Cash from Financing Activ. Change in Cash Mydeco Stock Price 76.7 25.7 (4.9) (4.9) 71.8 20.8 (7.3) (14.1) $9.64 21.5 25.5 9.8 4.6 $7.91 $3.69 $6.23 $9.24

Cornerstones of Financial Accounting
4th Edition
ISBN:9781337690881
Author:Jay Rich, Jeff Jones
Publisher:Jay Rich, Jeff Jones
Chapter12: Fainancial Statement Analysis
Section: Chapter Questions
Problem 55CE

Related questions
Question
- By what percentage did Mydeco's revenues grow each year from 2016 to 2019? (Round to two decimal places.)
- By what percentage did net income grow each year? (Round to two decimal places.)
- Why might the growth rates of revenues and net income differ? (Round to two decimal places.)
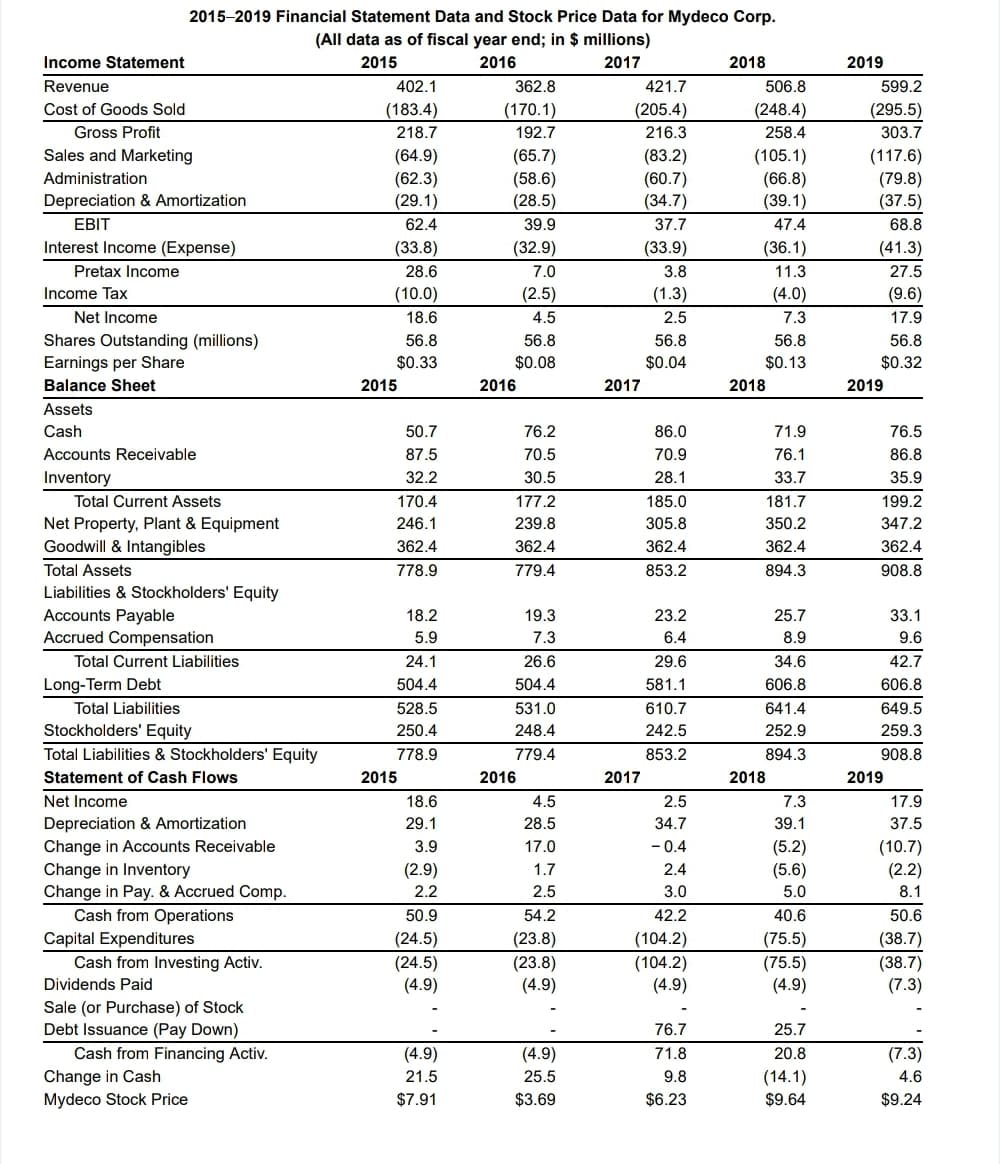
Transcribed Image Text:2015-2019 Financial Statement Data and Stock Price Data for Mydeco Corp.
(All data as of fiscal year end; in $ millions)
Income Statement
2015
2016
2017
2018
2019
Revenue
402.1
362.8
421.7
506.8
599.2
Cost of Goods Sold
(183.4)
(170.1)
(205.4)
(295.5)
(248.4)
258.4
Gross Profit
218.7
192.7
216.3
303.7
Sales and Marketing
(64.9)
(62.3)
(29.1)
(65.7)
(58.6)
(28.5)
(83.2)
(60.7)
(34.7)
(105.1)
(66.8)
(39.1)
47.4
(117.6)
(79.8)
(37.5)
Administration
Depreciation & Amortization
EBIT
62.4
39.9
37.7
68.8
Interest Income (Expense)
(33.8)
(32.9)
(33.9)
(36.1)
(41.3)
Pretax Income
28.6
7.0
3.8
11.3
27.5
Income Tax
(10.0)
(2.5)
(1.3)
(4.0)
(9.6)
Net Income
18.6
4.5
2.5
7.3
17.9
Shares Outstanding (millions)
Earnings per Share
56.8
56.8
56.8
56.8
56.8
$0.33
$0.08
$0.04
$0.13
$0.32
Balance Sheet
2015
2016
2017
2018
2019
Assets
Cash
50.7
76.2
86.0
71.9
76.5
Accounts Receivable
87.5
70.5
70.9
76.1
86.8
Inventory
32.2
30.5
28.1
33.7
35.9
Total Current Assets
170.4
177.2
185.0
181.7
199.2
Net Property, Plant & Equipment
Goodwill & Intangibles
246.1
239.8
305.8
350.2
347.2
362.4
362.4
362.4
362.4
362.4
Total Assets
778.9
779.4
853.2
894.3
908.8
Liabilities & Stockholders' Equity
Accounts Payable
Accrued Compensation
18.2
19.3
23.2
25.7
33.1
5.9
7.3
6.4
8.9
9.6
Total Current Liabilities
24.1
26.6
29.6
34.6
42.7
Long-Term Debt
504.4
504.4
581.1
606.8
606.8
Total Liabilities
528.5
531.0
610.7
641.4
649.5
Stockholders' Equity
250.4
248.4
242.5
252.9
259.3
Total Liabilities & Stockholders' Equity
778.9
779.4
853.2
894.3
908.8
Statement of Cash Flows
2015
2016
2017
2018
2019
Net Income
18.6
4.5
2.5
7.3
17.9
Depreciation & Amortization
Change in Accounts Receivable
Change in Inventory
Change in Pay. & Accrued Comp.
Cash from Operations
29.1
28.5
34.7
39.1
37.5
(10.7)
(2.2)
3.9
17.0
- 0.4
(5.2)
(5.6)
(2.9)
1.7
2.4
2.2
2.5
3.0
5.0
8.1
50.9
54.2
42.2
40.6
50.6
(104.2)
(104.2)
(4.9)
Capital Expenditures
(24.5)
(24.5)
(4.9)
(23.8)
(23.8)
(4.9)
(75.5)
(75.5)
(4.9)
(38.7)
(38.7)
(7.3)
Cash from Investing Activ.
Dividends Paid
Sale (or Purchase) of Stock
Debt Issuance (Pay Down)
76.7
25.7
Cash from Financing Activ.
Change in Cash
Mydeco Stock Price
(4.9)
(4.9)
71.8
20.8
(7.3)
21.5
25.5
9.8
(14.1)
4.6
$7.91
$3.69
$6.23
$9.64
$9.24
Expert Solution
This question has been solved!
Explore an expertly crafted, step-by-step solution for a thorough understanding of key concepts.

This is a popular solution!

Trending now
This is a popular solution!

Step by step
Solved in 4 steps

Knowledge Booster


Learn more about
Need a deep-dive on the concept behind this application? Look no further. Learn more about this topic, finance and related others by exploring similar questions and additional content below.Recommended textbooks for you
Cornerstones of Financial Accounting
Accounting
ISBN:
9781337690881
Author:
Jay Rich, Jeff Jones
Publisher:
Cengage Learning

Financial Accounting: The Impact on Decision Make…
Accounting
ISBN:
9781305654174
Author:
Gary A. Porter, Curtis L. Norton
Publisher:
Cengage Learning

Survey of Accounting (Accounting I)
Accounting
ISBN:
9781305961883
Author:
Carl Warren
Publisher:
Cengage Learning
Cornerstones of Financial Accounting
Accounting
ISBN:
9781337690881
Author:
Jay Rich, Jeff Jones
Publisher:
Cengage Learning
Financial Accounting: The Impact on Decision Make…
Accounting
ISBN:
9781305654174
Author:
Gary A. Porter, Curtis L. Norton
Publisher:
Cengage Learning
Survey of Accounting (Accounting I)
Accounting
ISBN:
9781305961883
Author:
Carl Warren
Publisher:
Cengage Learning

Intermediate Accounting: Reporting And Analysis
Accounting
ISBN:
9781337788281
Author:
James M. Wahlen, Jefferson P. Jones, Donald Pagach
Publisher:
Cengage Learning

Financial & Managerial Accounting
Accounting
ISBN:
9781285866307
Author:
Carl Warren, James M. Reeve, Jonathan Duchac
Publisher:
Cengage Learning

Financial Accounting
Accounting
ISBN:
9781337272124
Author:
Carl Warren, James M. Reeve, Jonathan Duchac
Publisher:
Cengage Learning