To be submitted: A factory manufactures steel rods. The rods are supposed to have a mean length of 25 cm. If there is evidence at a = 0.05 that the mean length for all rods is different from 25 cm the factory will be shut down and a costly maintenance procedure will ensue. If the mean length is different from 25 cm their customers will be unhappy and not use the company anymore. A random sample of 150 rods is taken. The lengths of those 150 rods are in the file rodsF20.xlsx. 1. Make a frequency table and histogram for the data with the first class of (23, 23.5) 2. Run a hypothesis test that tests the claim that the mean length for all rods is different from 25cm. 3. State your concdlusion in terms of the claim and whether you would recommend shutting down the factory. 4. State what a Type lerror is in context. 5. What are the likely consequences of making a Type l error? 6. State what a Type l error is in context. 7. What are the likely consequences of making a Type Il eror? 8. Find and interpret a 95% confidence interval for the mean length of all rods. 9. Based on the C would you recommend shutting down the factory. Justify. 10. Compare your conclusions in 3 and 9.
To be submitted: A factory manufactures steel rods. The rods are supposed to have a mean length of 25 cm. If there is evidence at a = 0.05 that the mean length for all rods is different from 25 cm the factory will be shut down and a costly maintenance procedure will ensue. If the mean length is different from 25 cm their customers will be unhappy and not use the company anymore. A random sample of 150 rods is taken. The lengths of those 150 rods are in the file rodsF20.xlsx. 1. Make a frequency table and histogram for the data with the first class of (23, 23.5) 2. Run a hypothesis test that tests the claim that the mean length for all rods is different from 25cm. 3. State your concdlusion in terms of the claim and whether you would recommend shutting down the factory. 4. State what a Type lerror is in context. 5. What are the likely consequences of making a Type l error? 6. State what a Type l error is in context. 7. What are the likely consequences of making a Type Il eror? 8. Find and interpret a 95% confidence interval for the mean length of all rods. 9. Based on the C would you recommend shutting down the factory. Justify. 10. Compare your conclusions in 3 and 9.

MATLAB: An Introduction with Applications
6th Edition
ISBN:9781119256830
Author:Amos Gilat
Publisher:Amos Gilat
Chapter1: Starting With Matlab
Section: Chapter Questions
Problem 1P

Related questions

Question
Question 4-10! and thak you in advance!
Here's the Data:
| Rod Length |
| 25.42 |
| 25.89 |
| 25.21 |
| 24.32 |
| 24.70 |
| 24.15 |
| 24.49 |
| 23.29 |
| 24.13 |
| 25.71 |
| 24.65 |
| 23.20 |
| 24.80 |
| 25.95 |
| 23.47 |
| 25.80 |
| 24.24 |
| 25.23 |
| 25.16 |
| 25.22 |
| 24.59 |
| 24.53 |
| 24.70 |
| 24.81 |
| 24.40 |
| 23.45 |
| 25.28 |
| 24.03 |
| 24.34 |
| 25.13 |
| 26.08 |
| 25.74 |
| 23.71 |
| 24.18 |
| 25.11 |
| 26.29 |
| 25.61 |
| 25.47 |
| 24.36 |
| 24.59 |
| 24.24 |
| 24.94 |
| 25.94 |
| 24.13 |
| 26.12 |
| 25.16 |
| 24.83 |
| 23.47 |
| 24.96 |
| 25.34 |
| 26.00 |
| 25.19 |
| 25.61 |
| 24.66 |
| 24.48 |
| 24.64 |
| 25.97 |
| 24.40 |
| 24.55 |
| 24.13 |
| 24.83 |
| 25.60 |
| 24.63 |
| 26.00 |
| 23.56 |
| 24.56 |
| 24.38 |
| 25.12 |
| 24.90 |
| 25.83 |
| 25.44 |
| 24.98 |
| 24.81 |
| 25.09 |
| 24.25 |
| 24.00 |
| 25.90 |
| 25.46 |
| 24.30 |
| 25.22 |
| 23.32 |
| 24.58 |
| 25.60 |
| 24.71 |
| 25.85 |
| 23.22 |
| 25.82 |
| 24.98 |
| 24.95 |
| 24.23 |
| 24.69 |
| 24.44 |
| 24.05 |
| 25.12 |
| 25.21 |
| 24.98 |
| 24.21 |
| 25.89 |
| 25.23 |
| 24.89 |
| 24.91 |
| 25.76 |
| 25.61 |
| 24.84 |
| 24.83 |
| 24.16 |
| 25.70 |
| 24.56 |
| 24.84 |
| 24.25 |
| 25.45 |
| 24.15 |
| 25.00 |
| 25.23 |
| 26.00 |
| 25.22 |
| 24.06 |
| 24.94 |
| 24.79 |
| 25.04 |
| 25.74 |
| 24.91 |
| 25.66 |
| 24.57 |
| 26.73 |
| 23.22 |
| 25.85 |
| 24.29 |
| 24.68 |
| 25.29 |
| 25.71 |
| 24.63 |
| 24.43 |
| 25.96 |
| 25.52 |
| 24.71 |
| 24.36 |
| 25.11 |
| 24.45 |
| 25.87 |
| 24.72 |
| 24.23 |
| 24.74 |
| 25.59 |
| 25.45 |
| 24.39 |
| 25.46 |
| 24.07 |
| 25.39 |
| 25.50 |
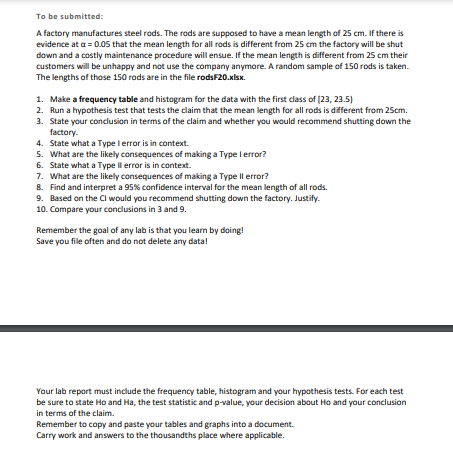
Transcribed Image Text:To be submitted:
A factory manufactures steel rods. The rods are supposed to have a mean length of 25 cm. If there is
evidence at a = 0.05 that the mean length for all rods is different from 25 cm the factory will be shut
down and a costly maintenance procedure will ensue. If the mean length is different from 25 cm their
customers will be unhappy and not use the company anymore. A random sample of 150 rods is taken.
The lengths of those 150 rods are in the file rodsF20.xlsx.
1. Make a frequency table and histogram for the data with the first class of (23, 23.5)
2. Run a hypothesis test that tests the claim that the mean length for all rods is different from 25cm.
3. State your conclusion in terms of the claim and whether you would recommend shutting down the
factory.
4. State what a Type lerror is in context.
5. What are the likely consequences of making a Type l error?
6. State what a Type Il error is in context.
7. What are the likely consequences of making a Type Il error?
8. Find and interpret a 95% confidence interval for the mean length of all rods.
9. Based on the CI would you recommend shutting down the factory. Justify.
10. Compare your conclusions in 3 and 9.
Remember the goal of any lab is that you learn by doing!
Save you file often and do not delete any data!
Your lab report must include the frequency table, histogram and your hypothesis tests. For each test
be sure to state Ho and Ha, the test statistic and p-value, your decision about Ho and your conclusion
in terms of the claim.
Remember to copy and paste your tables and graphs into a document.
Carry work and answers to the thousandths place where applicable.
Expert Solution
This question has been solved!
Explore an expertly crafted, step-by-step solution for a thorough understanding of key concepts.

This is a popular solution!

Trending now
This is a popular solution!

Step by step
Solved in 2 steps with 1 images

Knowledge Booster


Learn more about
Need a deep-dive on the concept behind this application? Look no further. Learn more about this topic, statistics and related others by exploring similar questions and additional content below.Recommended textbooks for you
MATLAB: An Introduction with Applications
Statistics
ISBN:
9781119256830
Author:
Amos Gilat
Publisher:
John Wiley & Sons Inc

Probability and Statistics for Engineering and th…
Statistics
ISBN:
9781305251809
Author:
Jay L. Devore
Publisher:
Cengage Learning

Statistics for The Behavioral Sciences (MindTap C…
Statistics
ISBN:
9781305504912
Author:
Frederick J Gravetter, Larry B. Wallnau
Publisher:
Cengage Learning
MATLAB: An Introduction with Applications
Statistics
ISBN:
9781119256830
Author:
Amos Gilat
Publisher:
John Wiley & Sons Inc
Probability and Statistics for Engineering and th…
Statistics
ISBN:
9781305251809
Author:
Jay L. Devore
Publisher:
Cengage Learning
Statistics for The Behavioral Sciences (MindTap C…
Statistics
ISBN:
9781305504912
Author:
Frederick J Gravetter, Larry B. Wallnau
Publisher:
Cengage Learning

Elementary Statistics: Picturing the World (7th E…
Statistics
ISBN:
9780134683416
Author:
Ron Larson, Betsy Farber
Publisher:
PEARSON

The Basic Practice of Statistics
Statistics
ISBN:
9781319042578
Author:
David S. Moore, William I. Notz, Michael A. Fligner
Publisher:
W. H. Freeman

Introduction to the Practice of Statistics
Statistics
ISBN:
9781319013387
Author:
David S. Moore, George P. McCabe, Bruce A. Craig
Publisher:
W. H. Freeman