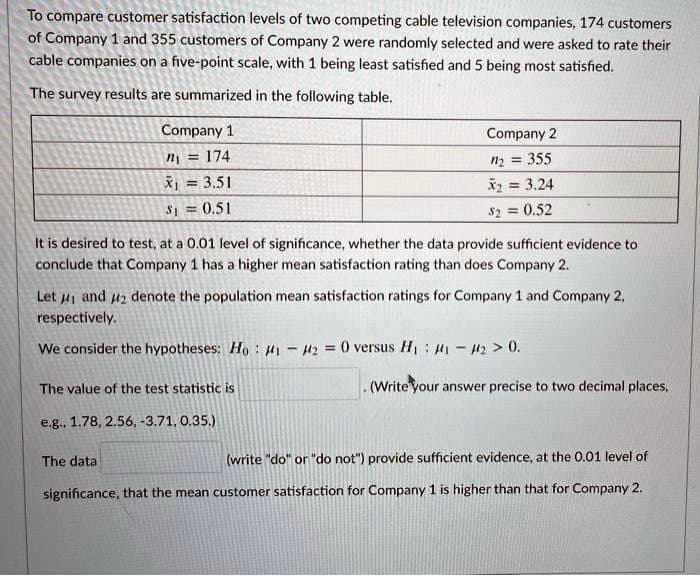
To compare customer satisfaction levels of two competing cable television companies, 174 customers of Company 1 and 355 customers of Company 2 were randomly selected and were asked to rate their cable companies on a five-point scale, with 1 being least satisfied and 5 being most satisfied. The survey results are summarized in the following table. Company 1 Company 2 ni = 174 = 3.51 355 š2 = 3.24 %3D 0.51 $2 = 0.52 It is desired to test, at a 0.01 level of significance, whether the data provide sufficient evidence to conclude that Company 1 has a higher mean satisfaction rating than does Company 2. Let H1 and u2 denote the population mean satisfaction ratings for Company 1 and Company 2, respectively.
To compare customer satisfaction levels of two competing cable television companies, 174 customers of Company 1 and 355 customers of Company 2 were randomly selected and were asked to rate their cable companies on a five-point scale, with 1 being least satisfied and 5 being most satisfied. The survey results are summarized in the following table. Company 1 Company 2 ni = 174 = 3.51 355 š2 = 3.24 %3D 0.51 $2 = 0.52 It is desired to test, at a 0.01 level of significance, whether the data provide sufficient evidence to conclude that Company 1 has a higher mean satisfaction rating than does Company 2. Let H1 and u2 denote the population mean satisfaction ratings for Company 1 and Company 2, respectively.

Glencoe Algebra 1, Student Edition, 9780079039897, 0079039898, 2018
18th Edition
ISBN:9780079039897
Author:Carter
Publisher:Carter
Chapter10: Statistics
Section: Chapter Questions
Problem 13PT

Related questions
Question
100%
Transcribed Image Text:To compare customer satisfaction levels of two competing cable television companies, 174 customers
of Company 1 and 355 customers of Company 2 were randomly selected and were asked to rate their
cable companies on a five-point scale, with 1 being least satisfied and 5 being most satisfied.
The survey results are summarized in the following table.
Company 1
Company 2
Nį = 174
!!
n2 = 355
X = 3.51
X2 = 3.24
S1 = 0.51
S2 = 0.52
It is desired to test, at a 0.01 level of significance, whether the data provide sufficient evidence to
conclude that Company 1 has a higher mean satisfaction rating than does Company 2.
Let Hi and u2 denote the population mean satisfaction ratings for Company 1 and Company 2,
respectively.
We consider the hypotheses: Ho H1 - H2 = 0 versus H: - 42 > 0.
%3!
The value of the test statistic is
.(Write your answer precise to two decimal places,
e.g., 1.78, 2.56, -3.71, 0.35.)
The data
(write "do" or "do not") provide sufficient evidence, at the 0.01 level of
significance, that the mean customer satisfaction for Company 1 is higher than that for Company 2.
Expert Solution
This question has been solved!
Explore an expertly crafted, step-by-step solution for a thorough understanding of key concepts.

This is a popular solution!

Trending now
This is a popular solution!

Step by step
Solved in 2 steps with 2 images

Recommended textbooks for you
Glencoe Algebra 1, Student Edition, 9780079039897…
Algebra
ISBN:
9780079039897
Author:
Carter
Publisher:
McGraw Hill

Holt Mcdougal Larson Pre-algebra: Student Edition…
Algebra
ISBN:
9780547587776
Author:
HOLT MCDOUGAL
Publisher:
HOLT MCDOUGAL

College Algebra (MindTap Course List)
Algebra
ISBN:
9781305652231
Author:
R. David Gustafson, Jeff Hughes
Publisher:
Cengage Learning
Glencoe Algebra 1, Student Edition, 9780079039897…
Algebra
ISBN:
9780079039897
Author:
Carter
Publisher:
McGraw Hill
Holt Mcdougal Larson Pre-algebra: Student Edition…
Algebra
ISBN:
9780547587776
Author:
HOLT MCDOUGAL
Publisher:
HOLT MCDOUGAL
College Algebra (MindTap Course List)
Algebra
ISBN:
9781305652231
Author:
R. David Gustafson, Jeff Hughes
Publisher:
Cengage Learning