To determine the endogenous variables and exogenous variables use the given diagram in the image.
To determine the endogenous variables and exogenous variables use the given diagram in the image.

Glencoe Algebra 1, Student Edition, 9780079039897, 0079039898, 2018
18th Edition
ISBN:9780079039897
Author:Carter
Publisher:Carter
Chapter10: Statistics
Section10.6: Summarizing Categorical Data
Problem 23PPS

Related questions
Question
Answer letters C and D. To determine the endogenous variables and exogenous variables use the given diagram in the image.
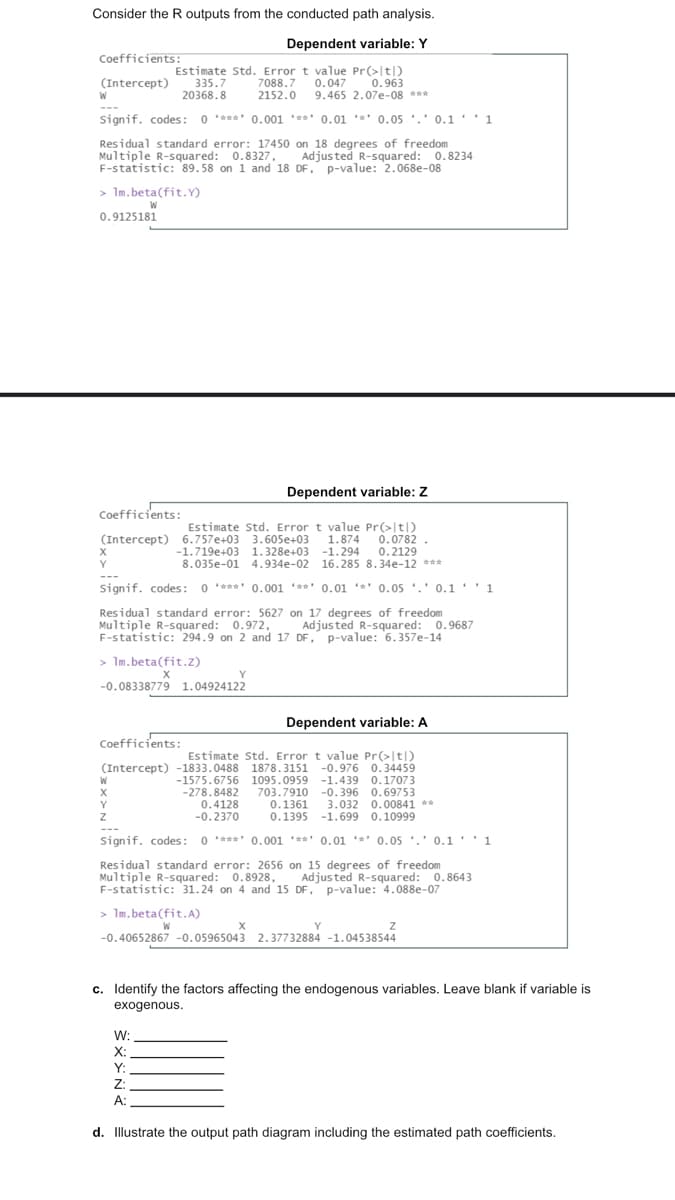
Transcribed Image Text:Consider the R outputs from the conducted path analysis.
Dependent variable: Y
Coefficients:
Estimate Std. Error t value Pr(>|t|)
7088,7
2152.0
(Intercept)
335.7
20368.8
0.047
0.963
9.465 2.07e-08 ***
---
Signif. codes: 0 ***** 0.001 **** 0.01 **' 0.05 '.' 0.1' '1
Residual standard error: 17450 on 18 degrees of freedom
Multiple R-squared: 0.8327,
F-statistic: 89.58 on 1 and 18 DF, p-value: 2.068e-08
Adjusted R-squared: 0.8234
> Im.beta(fit.Y)
0.9125181
Dependent variable: Z
Coefficients:
Estimate Std. Error t value Pr(>|t|)
0.0782 .
-1.294 0.2129
8.035e-01 4.934e-02 16.285 8.34e-12 ***
(Intercept) 6.757e+03 3.605e+03
-1.719e+03 1.328e+03
1.874
Y
---
Signif. codes: 0 ***** 0.001 ***' 0.01 *' 0.05 '.' 0.1 ·'1
Residual standard error: 5627 on 17 degrees of freedom
Multiple R-squared: 0.972, Adjusted R-squared: 0.9687
F-statistic: 294.9 on 2 and 17 DF, p-value: 6.357e-14
> Im.beta(fit.Z)
-0.08338779 1.04924122
Dependent variable: A
Coefficients:
Estimate Std. Error t value Pr(>|t|)
(Intercept) -1833.0488 1878.3151 -0.976 0.34459
-1575.6756 1095.0959 -1.439 0.17073
-278.8482
0.4128
-0.2370
W
703.7910 -0.396 0.69753
0.1361
0.1395
3.032 0.00841 **
-1.699 0.10999
Y
--
Signif. codes: 0 ***** 0.001 ***' 0.01 **' 0.05 '.' 0.1''1
Residual standard error: 2656 on 15 degrees of freedom
Multiple R-squared: 0.8928,
F-statistic: 31.24 on 4 and 15 DF, p-value: 4.088e-07
Adjusted R-squared: 0.8643
> Im.beta(fit.A)
-0.40652867 -0.05965043 2.37732884 -1.04538544
c. Identify the factors affecting the endogenous variables. Leave blank if variable is
exogenous.
W:
X:
Y:
Z:
A:
d. Illustrate the output path diagram including the estimated path coefficients.
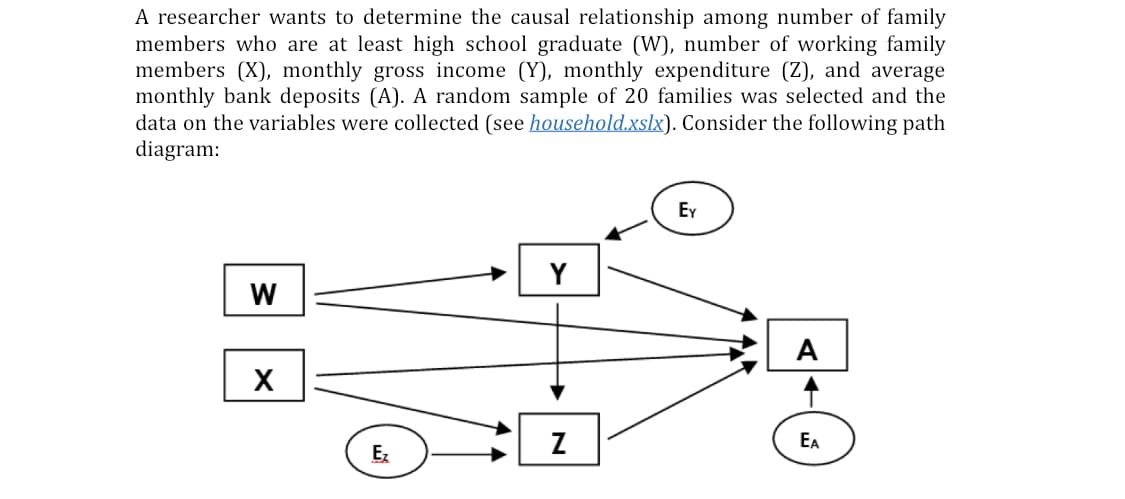
Transcribed Image Text:A researcher wants to determine the causal relationship among number of family
members who are at least high school graduate (W), number of working family
members (X), monthly gross income (Y), monthly expenditure (Z), and average
monthly bank deposits (A). A random sample of 20 families was selected and the
data on the variables were collected (see household.xslx). Consider the following path
diagram:
EY
Y
A
Z
EA
Ez
Expert Solution
This question has been solved!
Explore an expertly crafted, step-by-step solution for a thorough understanding of key concepts.

Step by step
Solved in 3 steps

Recommended textbooks for you
Glencoe Algebra 1, Student Edition, 9780079039897…
Algebra
ISBN:
9780079039897
Author:
Carter
Publisher:
McGraw Hill

Big Ideas Math A Bridge To Success Algebra 1: Stu…
Algebra
ISBN:
9781680331141
Author:
HOUGHTON MIFFLIN HARCOURT
Publisher:
Houghton Mifflin Harcourt
Glencoe Algebra 1, Student Edition, 9780079039897…
Algebra
ISBN:
9780079039897
Author:
Carter
Publisher:
McGraw Hill
Big Ideas Math A Bridge To Success Algebra 1: Stu…
Algebra
ISBN:
9781680331141
Author:
HOUGHTON MIFFLIN HARCOURT
Publisher:
Houghton Mifflin Harcourt