To test Hg: = 60 versus H,: u<60, a random sample of size n= 25 is obtained from a population that is known to be normally distributed. Complete parts (a) through (d) below. | Click here to view the t-Distribution Area in Right Tail. (0) # x = 56.5 and s = 14.5, compute the test statistic. 6 =O Round to three decimal places as needed) (6) F the researcher decides to test this hypothesis at the a=0.05 lvel of significance, determine the crtical value(s). Athough technology or a t-distribution table can be used to find the critical value, in this problem use the t-distribution table given. Crtical Value: O (Round to three decimal places. Use a comma to separate answers as needed ) (c) Draw atdistribution that depicts the critical region. Choose the corect answer below. OA. OB. Oc. (d) Will the researcher reject the null hypothesis? O A. Yes, because the test statistic falls in the critical region. OB. Yes, because the test statistic does not fall in the critical region. OC. No, because the test statistic does not fall in the critical region. OD. No, because the test statistic falls in the critical region.
To test Hg: = 60 versus H,: u<60, a random sample of size n= 25 is obtained from a population that is known to be normally distributed. Complete parts (a) through (d) below. | Click here to view the t-Distribution Area in Right Tail. (0) # x = 56.5 and s = 14.5, compute the test statistic. 6 =O Round to three decimal places as needed) (6) F the researcher decides to test this hypothesis at the a=0.05 lvel of significance, determine the crtical value(s). Athough technology or a t-distribution table can be used to find the critical value, in this problem use the t-distribution table given. Crtical Value: O (Round to three decimal places. Use a comma to separate answers as needed ) (c) Draw atdistribution that depicts the critical region. Choose the corect answer below. OA. OB. Oc. (d) Will the researcher reject the null hypothesis? O A. Yes, because the test statistic falls in the critical region. OB. Yes, because the test statistic does not fall in the critical region. OC. No, because the test statistic does not fall in the critical region. OD. No, because the test statistic falls in the critical region.

Glencoe Algebra 1, Student Edition, 9780079039897, 0079039898, 2018
18th Edition
ISBN:9780079039897
Author:Carter
Publisher:Carter
Chapter10: Statistics
Section10.1: Measures Of Center
Problem 9PPS

Related questions
Topic Video
Question
To test Upper H 0: mu equals 60 versus Upper H 1: mu less than60, a random sample of size N equals 25 is obtained from a population that is known to be

Transcribed Image Text:To test H,: µ= 60 versus H,: p < 60, a random sample of size n= 25 is obtained from a population that is known to be normally distributed. Complete parts (a) through (d) below.
E Click here to view the t-Distribution Area in Right Tail.
(a) If x = 56.5 and s = 14.5, compute the test statistic.
tn = (Round to three decimal places as needed.)
(b) If the researcher decides to test this hypothesis at the a= 0.05 level of significance, determine the critical value(s). Although technology or a t-distribution table can be used to find the critical value, in this problem use the t-distribution table given.
Critical Value:
(Round to three decimal places. Use a comma to separate answers as needed.)
(c) Draw a t-distribution that depicts the critical region. Choose the correct answer below.
O A.
O B.
OC.
ta
-t12
(d) Will the researcher reject the null hypothesis?
O A. Yes, because the test statistic falls in the critical region.
O B. Yes, because the test statistic does not fall in the critical region.
O C. No, because the test statistic does not fall in the critical region.
O D. No, because the test statistic falls in the critical region.
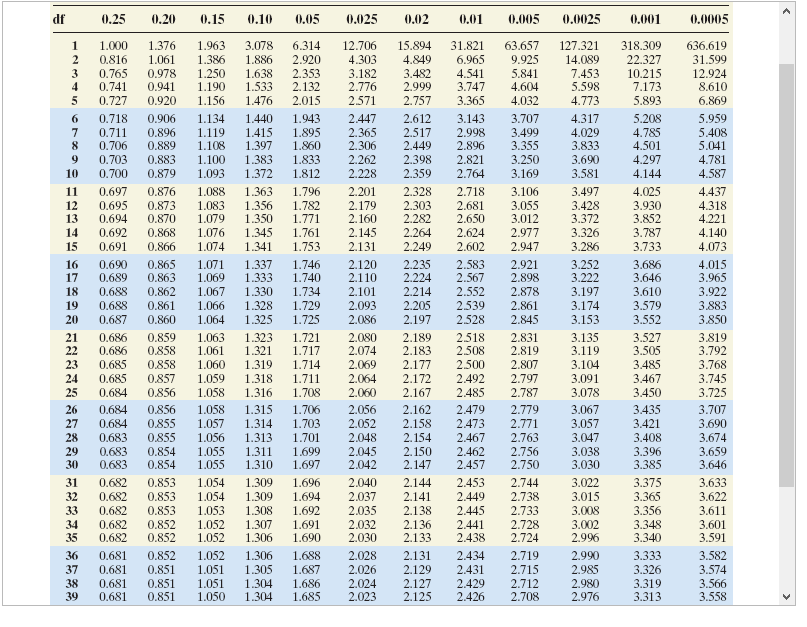
Transcribed Image Text:df
0.25
0.20
0.15
0.10
0.05
0.025
0,02
0.01
0.005
0.0025
0.001
0.0005
1
1.000
1.376
1.963
3.078
6.314
12.706
15.894
31.821
63.657
127.321
318.309
636.619
0.816
1.061
1.386
1.886
2.920
4.303
4.849
6.965
9.925
14.089
22.327
31.599
0.978
0.941
1.250
1.190
1.638
1.533
2.353
2.132
10.215
7.173
3
0.765
0.741
5
0.727
3.182
2.776
3.482
2.999
4.541
3.747
5.841
4.604
4.032
7.453
5.598
12.924
8.610
0.920
1.156
1.476
2.015
2.571
2.757
3.365
4.773
5.893
6.869
6.
0.718
0.906
1.134
1.440
1.943
2.447
2.612
3.143
3.707
4.317
5.208
5.959
0.896
0.889
2.517
2.449
4.029
3.833
3.690
7
0.711
0.706
1.119
1.108
1.415
1.397
1.895
1.860
2.365
2.306
2.998
2.896
3.499
3.355
4.785
4.501
5.408
5.041
2.821
4.781
4.587
0.703
0.883
1.100
1.383
1.833
2.262
2.228
2.398
3.250
4.297
10
0.700
0.879
1.093
1.372
1.812
2.359
2.764
3.169
3.581
4.144
11
0.697
0.876
1.363
1.356
1.079 1.350
1.088
1.796
2.201
2.328
2.718
3.106
3.497
4.025
4.437
1.782
1.771
1.083
12
13
0.695
0.694
0.873
0.870
2.179
2.160
2.303
2.282
2.681
2.650
3.055
3.012
2.977
3.428
3.372
3.930
3.852
3.787
4.318
4.221
4.140
14
0.692
0.868
1.076 1.345
1.761
2.145
2.264
2.624
3.326
15
0.691
0.866
1.074
1.341
1.753
2.131
2.249
2.602
2.947
3.286
3.733
4.073
16
17
0.690
0.689
0.865
0.863
0.862
1.071 1.337
1.069
1.333
1.746
1.740
2.120
2.110
2.235
2.224
2.583
2.567
2.921
2.898
3.252
3.222
3.686
3.646
4.015
3.965
18
0.688
1.067
1.066
1.330
1.328
1.734
2.101
2.214
2.552
2.878
3.197
3.610
3.922
0.688
0.687
2.539
3.579
3.552
19
0.861
1.729
2.093
2.205
2.861
3.174
3.883
20
0.860
1.064
1.325
1.725
2.086
2.197
2.528
2.845
3.153
3.850
21
22
0.686
0.686
0.859
0.858
1.063
1.061
1.323
1.321
1.721
1.717
2.080
2.074
2.189
2.183
2.518
2.508
2.831
2.819
3.135
3.119
3.527
3,505
3.485
3.467
3.819
3.792
1.319
1.318
3.104
3.091
3.078
23
0.685
0.685
0.684
0.858
1.060
1.714
2.069
2.177
2.500
2.807
3.768
1.711
1.708
24
0.857
1.059
2.064
2.172
2.492
2.797
3.745
25
0.856
1.058
1.316
2.060
2.167
2.485
2.787
3.450
3.725
26
0.684
0.856
1.058
1.315
1.706
2.056
3.435
3.707
2.162
2.158
2.479
2.779
3.067
0.684
0.683
27
0.855
1.057
1.314
2.473
1.703
1.701
2.052
2.771
3.057
3.421
3.690
28
0.855
1.056
1.313
3.674
2.048
2.045
2.042
2.154
2.467
2.763
3.047
3.408
29
30
0.683
0.683
2.150
2.147
0.854
1.055
1.055
1.311
1.310
1.699
2.462
2.457
2.756
2.750
3.038
3.030
3.396
3.385
3.659
3.646
0.854
1.697
1.696
1.694
1.692
1.691
1.690
2.144
2.141
2.138
3.375
3.365
3.633
3.622
3.611
3.601
3.591
31
0.682
0.853
1.054
1.309
2.040
2.453
2.744
2.738
3.022
3.015
3.008
32
0.682
0.853
1.054
1.309
2.037
2.449
33
0.682
0.853
1.053
1.308
2.035
2.445
2.733
3.356
34
35
0.682
0.852
0.852
1.052
1.052
1.307
1.306
2.032
2.030
2.136
2.133
2.441
2.438
2.728
2.724
3.002
2.996
3.348
3.340
0.682
1.688
1.687
1.686
1.685
2.434
3.333
3.582
3.574
3.566
3.558
36
0.681
0.852
0.851
1.052
1.306
2.028
2.026
2.131
2.719
2.990
37
0.681
1.051
1.305
1.304
1.304
2.129
2.431
2.715
2.985
3.326
38
39
0.681
0.681
0.851
0.851
1.051
1.050
2.024
2.023
2.127
2.125
2.429
2.426
2.712
2.708
2.980
2.976
3.319
3.313
Expert Solution
This question has been solved!
Explore an expertly crafted, step-by-step solution for a thorough understanding of key concepts.

This is a popular solution!

Trending now
This is a popular solution!

Step by step
Solved in 5 steps with 5 images

Knowledge Booster


Learn more about
Need a deep-dive on the concept behind this application? Look no further. Learn more about this topic, statistics and related others by exploring similar questions and additional content below.Recommended textbooks for you
Glencoe Algebra 1, Student Edition, 9780079039897…
Algebra
ISBN:
9780079039897
Author:
Carter
Publisher:
McGraw Hill
Glencoe Algebra 1, Student Edition, 9780079039897…
Algebra
ISBN:
9780079039897
Author:
Carter
Publisher:
McGraw Hill