To test the belief that sons are taller than their fathers, a student randomly selects 13 fathers who have adult male children. She records the height of both the father and son in inches and obtains the following data. Are sons taller than their fathers? Use the a = 0.10 level of significance. Note: A normal probability plot and boxplot of the data indicate that the differences are approximately normally distributed with no outliers. 1 Click the icon to view the table of data. Which conditions must be met by the sample for this test? Select all that apply. | A. The sampling method results in an independent sample. | B. The sample size is no more than 5% of the population size. | C. The differences are normally distributed or the sample size is large. O D. The sampling method results in a dependent sample. |E. The sample size must be large. Let d; = X; - Y;. Write the hypotheses for the test. Но: (1) H1: (2) Calculate the test statistic. to (Round to two decimal places as needed.) %3D Calculate the P-value. P-value = | (Round to three decimal places as needed.) Should the null hypothesis be rejected? (3). Họ because the P-value is (4) – the level of significance. There (5) fathers at the 0.10 level of significance. sufficient evidence to conclude that sons (6). their
To test the belief that sons are taller than their fathers, a student randomly selects 13 fathers who have adult male children. She records the height of both the father and son in inches and obtains the following data. Are sons taller than their fathers? Use the a = 0.10 level of significance. Note: A normal probability plot and boxplot of the data indicate that the differences are approximately normally distributed with no outliers. 1 Click the icon to view the table of data. Which conditions must be met by the sample for this test? Select all that apply. | A. The sampling method results in an independent sample. | B. The sample size is no more than 5% of the population size. | C. The differences are normally distributed or the sample size is large. O D. The sampling method results in a dependent sample. |E. The sample size must be large. Let d; = X; - Y;. Write the hypotheses for the test. Но: (1) H1: (2) Calculate the test statistic. to (Round to two decimal places as needed.) %3D Calculate the P-value. P-value = | (Round to three decimal places as needed.) Should the null hypothesis be rejected? (3). Họ because the P-value is (4) – the level of significance. There (5) fathers at the 0.10 level of significance. sufficient evidence to conclude that sons (6). their

Glencoe Algebra 1, Student Edition, 9780079039897, 0079039898, 2018
18th Edition
ISBN:9780079039897
Author:Carter
Publisher:Carter
Chapter10: Statistics
Section10.4: Distributions Of Data
Problem 19PFA

Related questions
Question
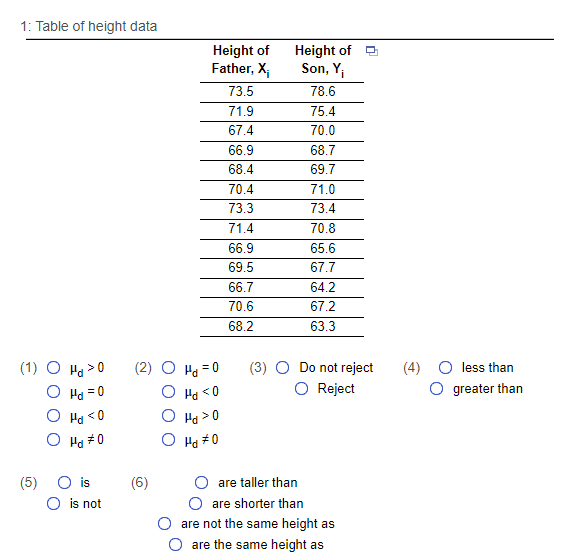
Transcribed Image Text:1: Table of height data
Height of
Father, X
Height of -
Son, Y¡
73.5
78.6
71.9
75.4
67.4
70.0
66.9
68.7
68.4
69.7
70.4
71.0
73.3
73.4
71.4
70.8
66.9
65.6
69.5
67.7
66.7
64.2
70.6
67.2
68.2
63.3
(2) O Ha = 0
O Hd <0
O Pa >0
O Hg #0
Do not reject
(1) O Ha >0
O Ha = 0
(3)
(4) O less than
%3D
O Reject
O greater than
0> Pri O
O Ha #0
(5)
is
(6)
are taller than
O is not
are shorter than
O are not the same height as
are the same height as
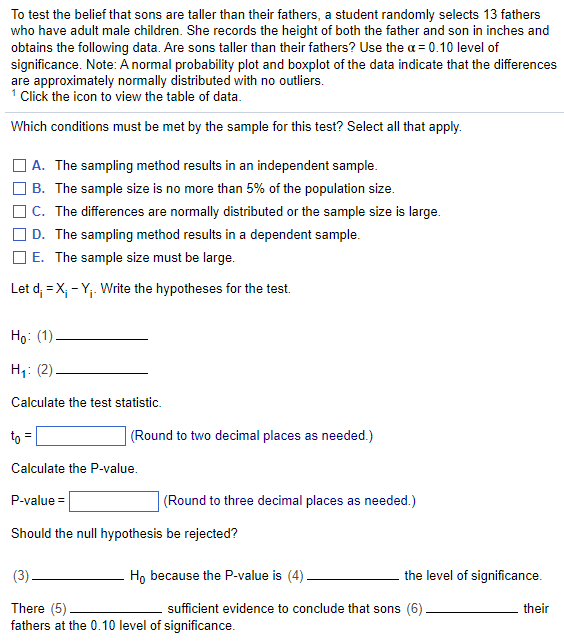
Transcribed Image Text:To test the belief that sons are taller than their fathers, a student randomly selects 13 fathers
who have adult male children. She records the height of both the father and son in inches and
obtains the following data. Are sons taller than their fathers? Use the a = 0.10 level of
significance. Note: A ormal probability plot and boxplot of the data indicate that the differences
are approximately normally distributed with no outliers.
1 Click the icon to view the table of data.
Which conditions must be met by the sample for this test? Select all that apply.
OA. The sampling method results in an independent sample.
B. The sample size is no more than 5% of the population size.
O C. The differences are normally distributed or the sample size is large.
O D. The sampling method results in a dependent sample.
O E. The sample size must be large.
Let d; = X, - Y;. Write the hypotheses for the test.
Но: (1)
Hа: (2)
Calculate the test statistic.
to =
(Round to two decimal places as needed.)
Calculate the P-value.
P-value =
(Round to three decimal places as needed.)
Should the null hypothesis be rejected?
H, because the P-value is (4)
the level of significance.
There (5)
fathers at the 0.10 level of significance.
sufficient evidence to conclude that sons (6)
their
Expert Solution
This question has been solved!
Explore an expertly crafted, step-by-step solution for a thorough understanding of key concepts.

Step by step
Solved in 2 steps with 1 images

Recommended textbooks for you
Glencoe Algebra 1, Student Edition, 9780079039897…
Algebra
ISBN:
9780079039897
Author:
Carter
Publisher:
McGraw Hill
Glencoe Algebra 1, Student Edition, 9780079039897…
Algebra
ISBN:
9780079039897
Author:
Carter
Publisher:
McGraw Hill