To test whether a sample - based on a random variable X - comes from a normally distributed population, the following single classification table was calculated: Observed frequency 20th 20th 21 30th 23 24 18th 14th Theoretical distribution 23.12 14.25 19.2 11/27 24.71 20.26 16.43 16.91 To determine the theoretical distribution, the mean of the population was estimated using the corresponding likelihood estimator of the sample. The standard deviation o of the population is given by dealer information. Test the hypothesis whether the population can be assumed to be normal. Name of the test procedure: OCi-square test for single classification tables O Ch-square test for a random variable X O Chi-square test for contingency tables O Four-field test Hypothesis: O The sample comes from a normally distributed population with an estimated mean value and a given standard deviation o O The sample comes from an exponentially distributed population O The sample comes from a normally distributed population with a given mean value u and a given standard deviation a O The sample comes from a normally distributed population with an estimated mean and an estimated standard deviation Test variable x (は0.03 Degrees of freedom (df): (+0 Critical valuec: |(土0.02 Null hypothesis Ho accept: Comment:
To test whether a sample - based on a random variable X - comes from a normally distributed population, the following single classification table was calculated: Observed frequency 20th 20th 21 30th 23 24 18th 14th Theoretical distribution 23.12 14.25 19.2 11/27 24.71 20.26 16.43 16.91 To determine the theoretical distribution, the mean of the population was estimated using the corresponding likelihood estimator of the sample. The standard deviation o of the population is given by dealer information. Test the hypothesis whether the population can be assumed to be normal. Name of the test procedure: OCi-square test for single classification tables O Ch-square test for a random variable X O Chi-square test for contingency tables O Four-field test Hypothesis: O The sample comes from a normally distributed population with an estimated mean value and a given standard deviation o O The sample comes from an exponentially distributed population O The sample comes from a normally distributed population with a given mean value u and a given standard deviation a O The sample comes from a normally distributed population with an estimated mean and an estimated standard deviation Test variable x (は0.03 Degrees of freedom (df): (+0 Critical valuec: |(土0.02 Null hypothesis Ho accept: Comment:

MATLAB: An Introduction with Applications
6th Edition
ISBN:9781119256830
Author:Amos Gilat
Publisher:Amos Gilat
Chapter1: Starting With Matlab
Section: Chapter Questions
Problem 1P

Related questions
Topic Video
Question
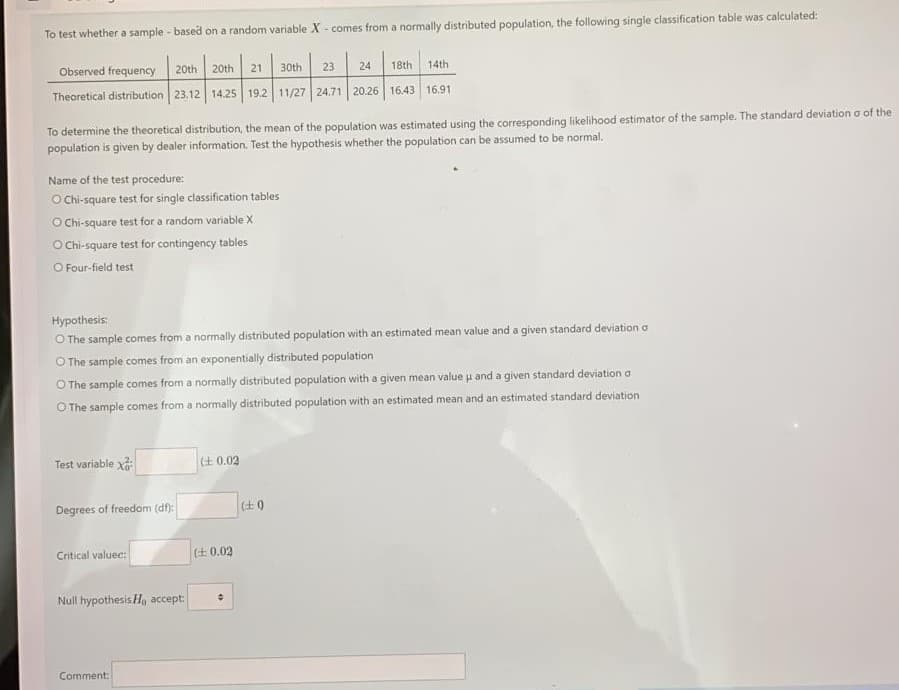
Transcribed Image Text:To test whether a sample - based on a random variable X - comes from a normally distributed population, the following single classification table was calculated:
Observed frequency
20th
20th
21
30th
23
24
18th
14th
Theoretical distribution 23.12 14.25 19.2 11/27 24.71 20.26 16.43 16.91
To determine the theoretical distribution, the mean of the population was estimated using the corresponding likelihood estimator of the sample. The standard deviation o of the
population is given by dealer information. Test the hypothesis whether the population can be assumed to be normal.
Name of the test procedure:
OCi-square test for single classification tables
O Chi-square test for a random variable X
O Chi-square test for contingency tables
O Four-field test
Hypothesis:
O The sample comes from a normally distributed population with an estimated mean value and a given standard deviation o
O The sample comes from an exponentially distributed population
O The sample comes from a normally distributed population with a given mean value u and a given standard deviation a
O The sample comes from a normally distributed population with an estimated mean and an estimated standard deviation
Test variable xd:
(+ 0.02
Degrees of freedom (df):
(+0
Critical valuec:
|(土0.02
Null hypothesis Ho accept:
Comment:
Expert Solution
This question has been solved!
Explore an expertly crafted, step-by-step solution for a thorough understanding of key concepts.

Step by step
Solved in 2 steps with 2 images

Knowledge Booster


Learn more about
Need a deep-dive on the concept behind this application? Look no further. Learn more about this topic, statistics and related others by exploring similar questions and additional content below.Recommended textbooks for you
MATLAB: An Introduction with Applications
Statistics
ISBN:
9781119256830
Author:
Amos Gilat
Publisher:
John Wiley & Sons Inc

Probability and Statistics for Engineering and th…
Statistics
ISBN:
9781305251809
Author:
Jay L. Devore
Publisher:
Cengage Learning

Statistics for The Behavioral Sciences (MindTap C…
Statistics
ISBN:
9781305504912
Author:
Frederick J Gravetter, Larry B. Wallnau
Publisher:
Cengage Learning
MATLAB: An Introduction with Applications
Statistics
ISBN:
9781119256830
Author:
Amos Gilat
Publisher:
John Wiley & Sons Inc
Probability and Statistics for Engineering and th…
Statistics
ISBN:
9781305251809
Author:
Jay L. Devore
Publisher:
Cengage Learning
Statistics for The Behavioral Sciences (MindTap C…
Statistics
ISBN:
9781305504912
Author:
Frederick J Gravetter, Larry B. Wallnau
Publisher:
Cengage Learning

Elementary Statistics: Picturing the World (7th E…
Statistics
ISBN:
9780134683416
Author:
Ron Larson, Betsy Farber
Publisher:
PEARSON

The Basic Practice of Statistics
Statistics
ISBN:
9781319042578
Author:
David S. Moore, William I. Notz, Michael A. Fligner
Publisher:
W. H. Freeman

Introduction to the Practice of Statistics
Statistics
ISBN:
9781319013387
Author:
David S. Moore, George P. McCabe, Bruce A. Craig
Publisher:
W. H. Freeman