Topic: Correlation and Regression. Using the F-distribution table to find the answers where necessary. D) , e) and f) need answers for these questions attached.
Topic: Correlation and Regression. Using the F-distribution table to find the answers where necessary. D) , e) and f) need answers for these questions attached.

College Algebra
7th Edition
ISBN:9781305115545
Author:James Stewart, Lothar Redlin, Saleem Watson
Publisher:James Stewart, Lothar Redlin, Saleem Watson
Chapter1: Equations And Graphs
Section: Chapter Questions
Problem 10T: Olympic Pole Vault The graph in Figure 7 indicates that in recent years the winning Olympic men’s...

Related questions
Question
Topic:
D) , e) and f)
need answers for these questions attached.
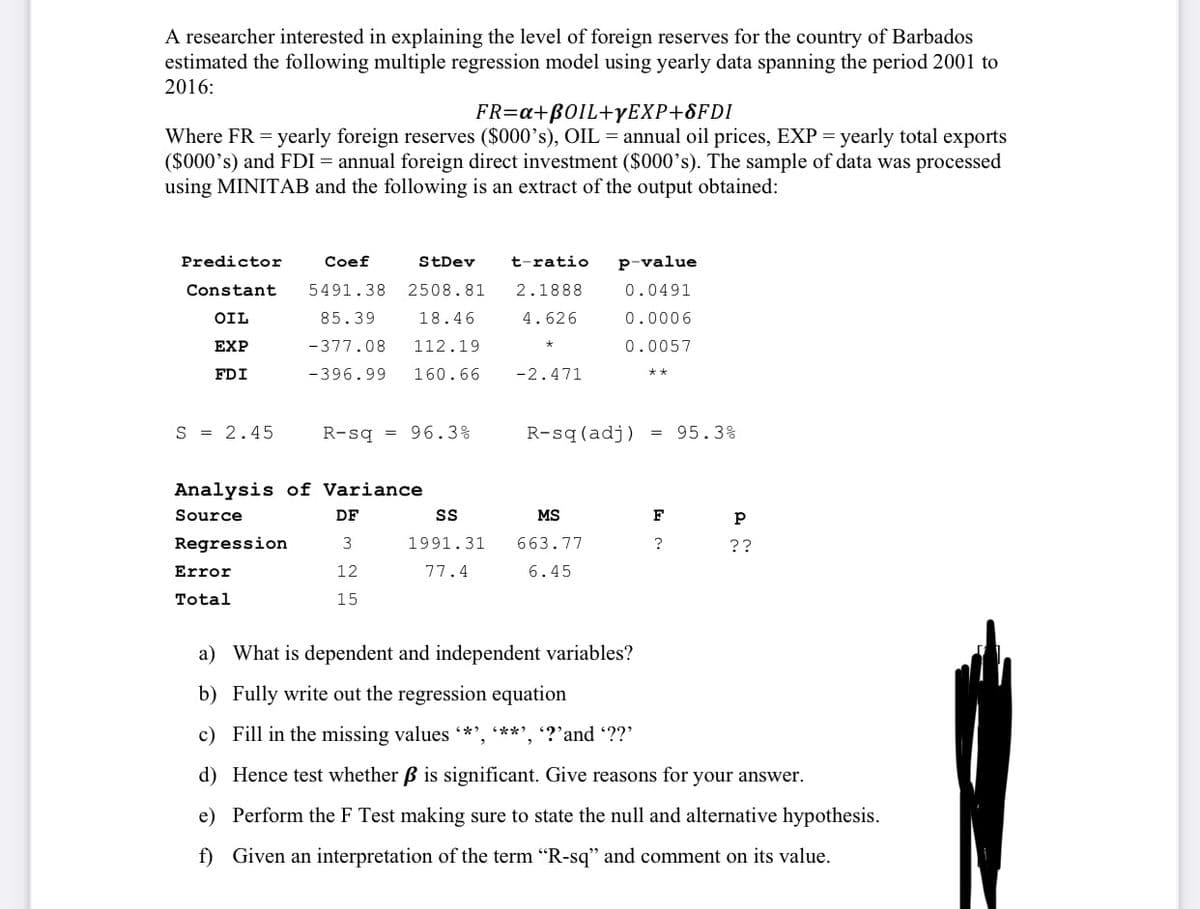
Transcribed Image Text:A researcher interested in explaining the level of foreign reserves for the country of Barbados
estimated the following multiple regression model using yearly data spanning the period 2001 to
2016:
FR=a+B0IL+YEXP+8FDI
Where FR = yearly foreign reserves ($000's), OIL = annual oil prices, EXP = yearly total exports
($000's) and FDI = annual foreign direct investment ($000’s). The sample of data was processed
using MINITAB and the following is an extract of the output obtained:
Predictor
Coef
StDev
t-ratio
p-value
Constant
5491.38
2508.81
2.1888
0.0491
OIL
85.39
18.46
4.626
0.0006
ЕXP
-377.08
112.19
0.0057
FDI
-396.99
160.66
-2.471
S = 2.45
R-sq = 96.3%
R-sq(adj)
= 95.3%
Analysis of Variance
Source
DF
MS
F
Regression
3
1991.31
663.77
?
??
Error
12
77.4
6.45
Total
15
a) What is dependent and independent variables?
b) Fully write out the regression equation
c) Fill in the missing values *', **', '?’and ??'
d) Hence test whether B is significant. Give reasons for your answer.
e) Perform the F Test making sure to state the null and alternative hypothesis.
f) Given an interpretation of the term "R-sq" and comment on its value.
Expert Solution
This question has been solved!
Explore an expertly crafted, step-by-step solution for a thorough understanding of key concepts.

Step by step
Solved in 4 steps with 2 images

Knowledge Booster


Learn more about
Need a deep-dive on the concept behind this application? Look no further. Learn more about this topic, statistics and related others by exploring similar questions and additional content below.Recommended textbooks for you
College Algebra
Algebra
ISBN:
9781305115545
Author:
James Stewart, Lothar Redlin, Saleem Watson
Publisher:
Cengage Learning

Linear Algebra: A Modern Introduction
Algebra
ISBN:
9781285463247
Author:
David Poole
Publisher:
Cengage Learning

Glencoe Algebra 1, Student Edition, 9780079039897…
Algebra
ISBN:
9780079039897
Author:
Carter
Publisher:
McGraw Hill
College Algebra
Algebra
ISBN:
9781305115545
Author:
James Stewart, Lothar Redlin, Saleem Watson
Publisher:
Cengage Learning
Linear Algebra: A Modern Introduction
Algebra
ISBN:
9781285463247
Author:
David Poole
Publisher:
Cengage Learning
Glencoe Algebra 1, Student Edition, 9780079039897…
Algebra
ISBN:
9780079039897
Author:
Carter
Publisher:
McGraw Hill

Big Ideas Math A Bridge To Success Algebra 1: Stu…
Algebra
ISBN:
9781680331141
Author:
HOUGHTON MIFFLIN HARCOURT
Publisher:
Houghton Mifflin Harcourt