(a) State, with a reason, which variable is the response variable. (b) Obtain the scatter plot for the data and comment on the relationship between the variables. (c) Determine the Pearson correlation coefficient and comment on the result obtained.

Algebra & Trigonometry with Analytic Geometry
13th Edition
ISBN:9781133382119
Author:Swokowski
Publisher:Swokowski
Chapter7: Analytic Trigonometry
Section7.6: The Inverse Trigonometric Functions
Problem 92E
icon
Related questions
icon
Concept explainers
Question
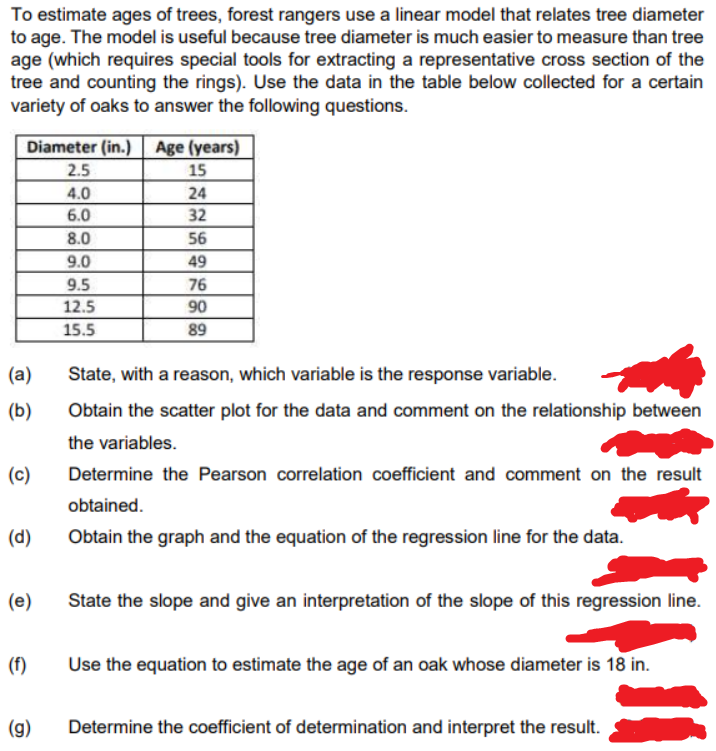
To estimate ages of trees, forest rangers use a linear model that relates tree diameter
to age. The model is useful because tree diameter is much easier to measure than tree
age (which requires special tools for extracting a representative cross section of the
tree and counting the rings). Use the data in the table below collected for a certain
variety of oaks to answer the following questions.
Diameter (in.) Age (years)
2.5
15
4.0
24
6.0
32
8.0
56
9.0
49
9.5
76
12.5
90
15.5
89
(a)
State, with a reason, which variable is the response variable.
(b)
Obtain the scatter plot for the data and comment on the relationship between
the variables.
(c)
Determine the Pearson correlation coefficient and comment on the result
obtained.
(d)
Obtain the graph and the equation of the regression line for the data.
(e)
State the slope and give an interpretation of the slope of this regression line.
(f)
Use the equation to estimate the age of an oak whose diameter is 18 in.
(g)
Determine the coefficient of determination and interpret the result.
Transcribed Image Text:To estimate ages of trees, forest rangers use a linear model that relates tree diameter to age. The model is useful because tree diameter is much easier to measure than tree age (which requires special tools for extracting a representative cross section of the tree and counting the rings). Use the data in the table below collected for a certain variety of oaks to answer the following questions. Diameter (in.) Age (years) 2.5 15 4.0 24 6.0 32 8.0 56 9.0 49 9.5 76 12.5 90 15.5 89 (a) State, with a reason, which variable is the response variable. (b) Obtain the scatter plot for the data and comment on the relationship between the variables. (c) Determine the Pearson correlation coefficient and comment on the result obtained. (d) Obtain the graph and the equation of the regression line for the data. (e) State the slope and give an interpretation of the slope of this regression line. (f) Use the equation to estimate the age of an oak whose diameter is 18 in. (g) Determine the coefficient of determination and interpret the result.
Expert Solution
trending now

Trending now

This is a popular solution!

steps

Step by step

Solved in 3 steps with 2 images

Blurred answer
Knowledge Booster
Correlation, Regression, and Association
Learn more about
Need a deep-dive on the concept behind this application? Look no further. Learn more about this topic, statistics and related others by exploring similar questions and additional content below.
Recommended textbooks for you
Algebra & Trigonometry with Analytic Geometry
Algebra
ISBN:
9781133382119
Author:
Swokowski
Publisher:
Cengage
Glencoe Algebra 1, Student Edition, 9780079039897…
Algebra
ISBN:
9780079039897
Author:
Carter
Publisher:
McGraw Hill