
College Accounting, Chapters 1-27
23rd Edition
ISBN:9781337794756
Author:HEINTZ, James A.
Publisher:HEINTZ, James A.
Chapter24: Analysis Of Financial Statements
Section: Chapter Questions
Problem 5CE

Related questions
Question
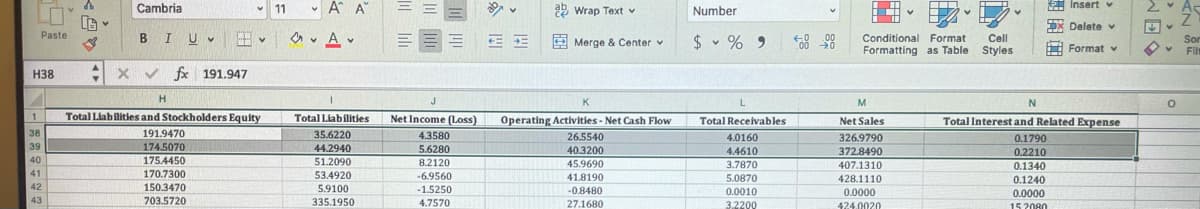
Find the ROE for Potbelly Corporation for the year 2015, use highlighted excel company information for 2014 and 2015 to find average shareholders equity. List steps taken please
Transcribed Image Text:Cambria
- 11
- A A
ab Wrap Text v
Insert v
As
Number
EX Delete v
Paste
BIUV
田
o v A v
$ v % 9
00
Conditional Format
Cell
E Merge & Center v
A Format v
Son
Flt
Formatting as Table
Styles
H38
X V fx 191.947
H
K
L
M
N
1
Total Liabilities and Stockholders Equity
Total Liabilities
Net Income (Loss)
Operating Activities - Net Cash Flow
Total Receivables
Total Interest and Related Expense
Net Sales
191.9470
174.5070
38
35.6220
4.3580
26.5540
4.0160
326.9790
0.1790
0.2210
39
44.2940
51.2090
5.6280
40.3200
4.4610
372.8490
40
175.4450
8.2120
45.9690
3.7870
407.1310
0.1340
41
170.7300
53.4920
-6.9560
41.8190
5.0870
428.1110
0.1240
42
150.3470
5.9100
-1.5250
-0.8480
0.0010
0.0000
0.0000
43
703.5720
335.1950
4.7570
27.1680
3.2200
424.0020
15 2080
> >>
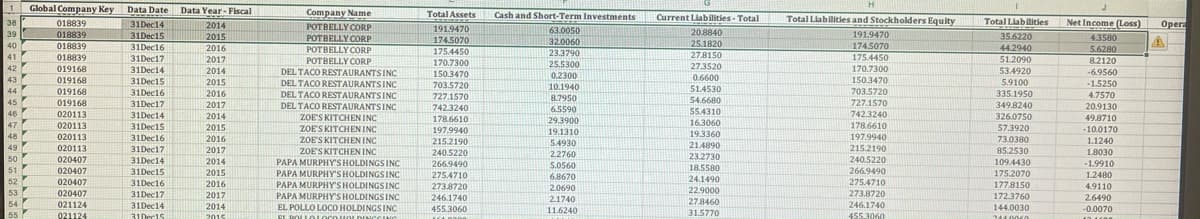
Transcribed Image Text:Global Company Key
Data Date Data Year- Fiscal
Company Name
Total Assets
Cash and Short-Term Investments
Current Liabilitles- Total
Total Liabilities and Stockholders Equity
Net Income (Loss)
Total Liabilities
018839
018839
Oper
38
31Dec14
2014
POTBELLY CORP
POTBELLY CORP
191.9470
63.0050
32.0060
23.3790
20.8840
25.1820
39
191.9470
31Dec15
31Dec16
2015
174.5070
35.6220
43580
018839
1745070
40
2016
POTBELLY CORP
POTBELLY OORP
DEL TACO RESTAURANTS INC
44.2940
5.6280
8.2120
175.4450
41
018839
31Dec17
27.8150
175.4450
2017
2014
51.2090
53.4920
170.7300
25.5300
27.3520
170.7300
42
019168
31Dec14
150.3470
0.2300
-6.9560
019168
019168
43
31Dec15
2015
0.6600
150.3470
5.9100
DEL TACO RESTAURANTSINC
703.5720
10.1940
-1.5250
44
51.4530
703.5720
31Dec16
31Dec17
2016
DEL TACO RESTAURANTSINC
DEL TACO RESTAURANTSINC
335.1950
349.8240
727.1570
8.7950
4.7570
45
019168
2017
54.6680
727.1570
742.3240
6.5590
20.9130
46
020113
31Dec14
2014
S5.4310
742.3240
326.0750
ZOE'S KITCHEN INC
178.6610
29.3900
49.8710
47
020113
31Dec15
2015
16.3060
178.6610
57.3920
ZOE'S KITCHENINC
ZOE'S KITCHEN INC
197.9940
19.1310
19.3360
-10.0170
48
020113
31Dec16
2016
215.2190
197.9940
73.0380
1.1240
5.4930
21.4890
49
020113
31Dec17
215.2190
240.5220
266.9490
2017
ZOE'S KITCHEN INC
PAPA MURPHYSHOLDINGS INC
85.2530
109.4430
2.2760
18030
020407
23.2730
50
240.5220
266.9490
31Dec14
2014
-1.9910
5.0560
18.5580
51
020407
31Dec15
2015
PAPA MURPHYSHOLDINGSINC
PAPA MURPHYSHOLDINGSINC
PAPA MURPHYS HOLDINGS INC
EL POLLO LOCO HOLDINGS INC
275.4710
6.8670
175.2070
1.2480
52
020407
31Dec16
2016
24.1490
275.4710
2738720
2.0690
177.8150
4.9110
53
020407
31Dec17
2017
22.9000
273.8720
172.3760
246.1740
455.3060
2.1740
2.6490
54
021124
27.8460
246.1740
455 3060
31Dec14
2014
11.6240
144.0030
-0.0070
55
021124
31 Dec15
31.5770
2015
CL POL IOLOCO HOLDUNCCI
214.0060
Expert Solution
This question has been solved!
Explore an expertly crafted, step-by-step solution for a thorough understanding of key concepts.

Step by step
Solved in 4 steps with 1 images

Knowledge Booster


Learn more about
Need a deep-dive on the concept behind this application? Look no further. Learn more about this topic, finance and related others by exploring similar questions and additional content below.Recommended textbooks for you
College Accounting, Chapters 1-27
Accounting
ISBN:
9781337794756
Author:
HEINTZ, James A.
Publisher:
Cengage Learning,

Survey of Accounting (Accounting I)
Accounting
ISBN:
9781305961883
Author:
Carl Warren
Publisher:
Cengage Learning

Financial And Managerial Accounting
Accounting
ISBN:
9781337902663
Author:
WARREN, Carl S.
Publisher:
Cengage Learning,
College Accounting, Chapters 1-27
Accounting
ISBN:
9781337794756
Author:
HEINTZ, James A.
Publisher:
Cengage Learning,
Survey of Accounting (Accounting I)
Accounting
ISBN:
9781305961883
Author:
Carl Warren
Publisher:
Cengage Learning
Financial And Managerial Accounting
Accounting
ISBN:
9781337902663
Author:
WARREN, Carl S.
Publisher:
Cengage Learning,

Century 21 Accounting Multicolumn Journal
Accounting
ISBN:
9781337679503
Author:
Gilbertson
Publisher:
Cengage

Managerial Accounting
Accounting
ISBN:
9781337912020
Author:
Carl Warren, Ph.d. Cma William B. Tayler
Publisher:
South-Western College Pub