Two-sample t-tést, independent groupS Listening Group Reading Group 10 15 10 12 7 13 12 11 8 10 8. 9. 10 11 10 11 11
Two-sample t-tést, independent groupS Listening Group Reading Group 10 15 10 12 7 13 12 11 8 10 8. 9. 10 11 10 11 11

MATLAB: An Introduction with Applications
6th Edition
ISBN:9781119256830
Author:Amos Gilat
Publisher:Amos Gilat
Chapter1: Starting With Matlab
Section: Chapter Questions
Problem 1P

Related questions
Topic Video
Question
Given the information what are the t-critical and t-observed values?
Transcribed Image Text:atistics for The E X
* Two-Sample t-test Quiz
4764/assignments/356579?module_item_id%3D775608
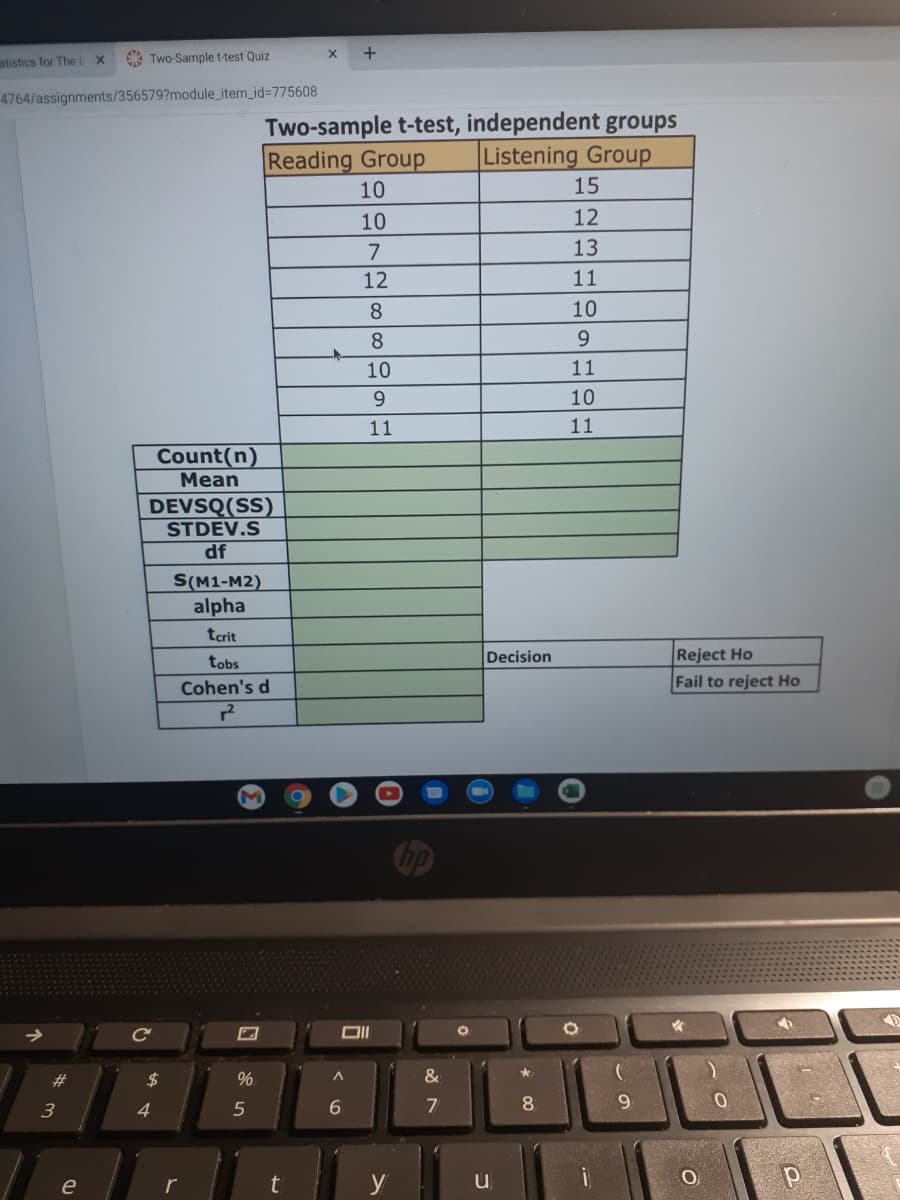
Two-sample t-test, independent groups
Listening Group
Reading Group
10
15
10
12
7
13
12
11
8.
10
8
9.
10
11
9.
10
11
11
Count(n)
Мean
DEVSQ(SS)
STDEV.S
df
S(M1-M2)
alpha
tcrit
Decision
Reject Ho
tobs
Cohen's d
Fail to reject Ho
Ce
#3
%
3
4
6.
8
9.
y
i
e
r
Transcribed Image Text:GRH
Two Sample t tet Vacoine Ex X
O Essentials of Statistics for The E x Two Sample t-test Quiz
imperial instructure.com/courses/14764/assignments/356579?module_item_id=775608
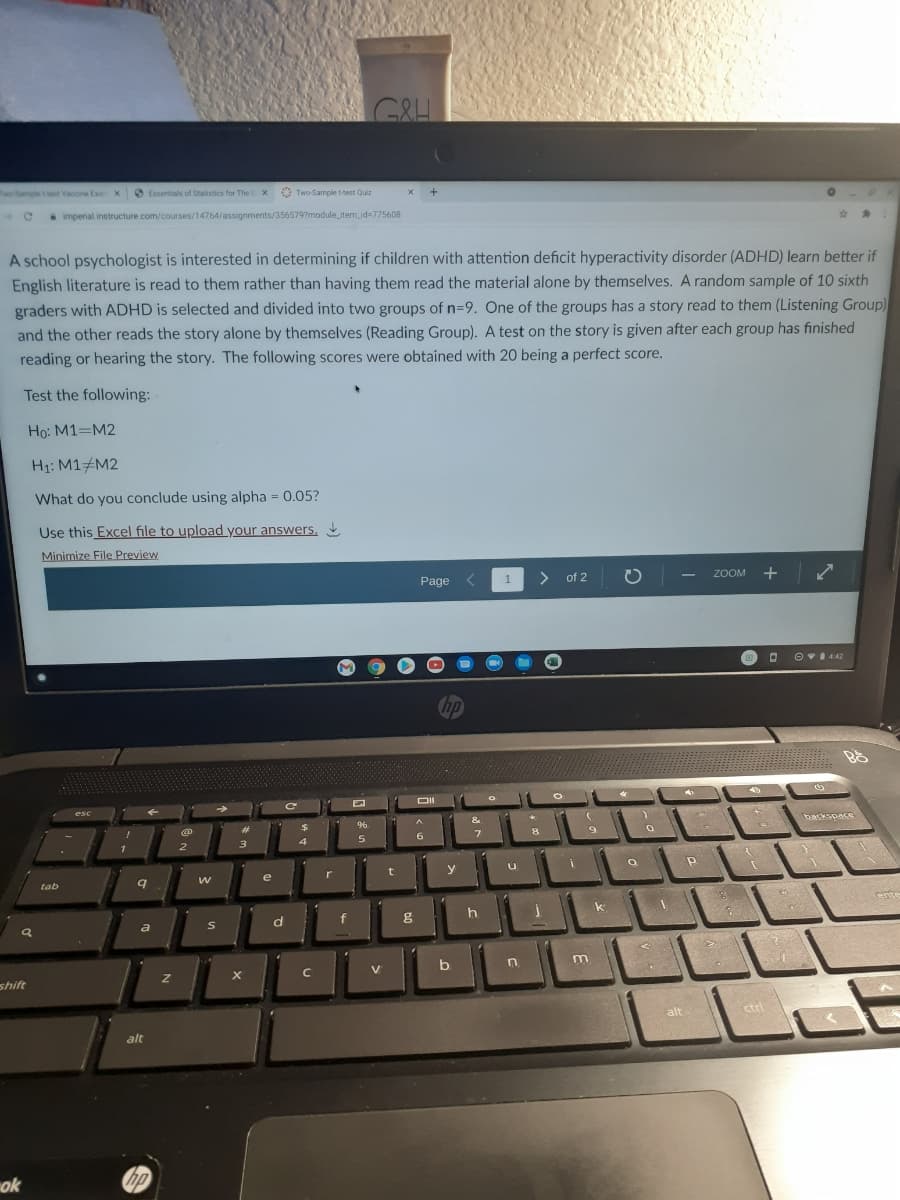
A school psychologist is interested in determining if children with attention deficit hyperactivity disorder (ADHD) learn better if
English literature is read to them rather than having them read the material alone by themselves. A random sample of 10 sixth
graders with ADHD is selected and divided into two groups of n=9. One of the groups has a story read to them (Listening Group)
and the other reads the story alone by themselves (Reading Group). A test on the story is given after each group has finished
reading or hearing the story. The following scores were obtained with 20 being a perfect score.
Test the following:
Ho: M1=M2
H1: M1#M2
What do you conclude using alpha = 0.05?
Use this Excel file to upload your answers,
Minimize File Preview
Page
1
> of 2
ZOOM
+
O v1 442
&
9
e
r
t
y
tab
k
ente
a
d
f
h
shift
alt
ctri
alt
ok
hp
Expert Solution
This question has been solved!
Explore an expertly crafted, step-by-step solution for a thorough understanding of key concepts.

Step by step
Solved in 2 steps with 3 images

Knowledge Booster


Learn more about
Need a deep-dive on the concept behind this application? Look no further. Learn more about this topic, statistics and related others by exploring similar questions and additional content below.Recommended textbooks for you
MATLAB: An Introduction with Applications
Statistics
ISBN:
9781119256830
Author:
Amos Gilat
Publisher:
John Wiley & Sons Inc

Probability and Statistics for Engineering and th…
Statistics
ISBN:
9781305251809
Author:
Jay L. Devore
Publisher:
Cengage Learning

Statistics for The Behavioral Sciences (MindTap C…
Statistics
ISBN:
9781305504912
Author:
Frederick J Gravetter, Larry B. Wallnau
Publisher:
Cengage Learning
MATLAB: An Introduction with Applications
Statistics
ISBN:
9781119256830
Author:
Amos Gilat
Publisher:
John Wiley & Sons Inc
Probability and Statistics for Engineering and th…
Statistics
ISBN:
9781305251809
Author:
Jay L. Devore
Publisher:
Cengage Learning
Statistics for The Behavioral Sciences (MindTap C…
Statistics
ISBN:
9781305504912
Author:
Frederick J Gravetter, Larry B. Wallnau
Publisher:
Cengage Learning

Elementary Statistics: Picturing the World (7th E…
Statistics
ISBN:
9780134683416
Author:
Ron Larson, Betsy Farber
Publisher:
PEARSON

The Basic Practice of Statistics
Statistics
ISBN:
9781319042578
Author:
David S. Moore, William I. Notz, Michael A. Fligner
Publisher:
W. H. Freeman

Introduction to the Practice of Statistics
Statistics
ISBN:
9781319013387
Author:
David S. Moore, George P. McCabe, Bruce A. Craig
Publisher:
W. H. Freeman