The following three independent random samples are obtained from three normally distributed populations with equal variance. The dependent variable is starting hourly wage, and the groups are the types of position (internship, co-op, work study). Group 1: Internship Group 2: Co-op Group 3: Work Study 14 14.75 8.25 14.75 14.75 15.5 16.5 14.25 13 16 15.25 14.25 15.25 15 15 14 11.5 12.75 13.5 13 14.25 15.25 14.5 14.5 15 12.5 12.75 This data can be downloaded in serial format using this link: Download CSV Use your statistical software package to conduct a one-factor ANOVA to determine if the group means are equal using a = 0.05. Though not specifically assessed here, you are encouraged to also test the assumptions, plot the group means, and interpret the results. Group means (report to 2 decimal places): Group 1: Internship: Group 2: Co-op: Group 3: Work Study: ANOVA summary statistics: F-ratio = (report accurate to 3 decimal places) (report accurate to 4 decimal places) Conclusion: O The sample data suggest the average starting hourly wages are not the same. O There is not sufficient data to conclude the starting wages are different for the different groups.
The following three independent random samples are obtained from three normally distributed populations with equal variance. The dependent variable is starting hourly wage, and the groups are the types of position (internship, co-op, work study). Group 1: Internship Group 2: Co-op Group 3: Work Study 14 14.75 8.25 14.75 14.75 15.5 16.5 14.25 13 16 15.25 14.25 15.25 15 15 14 11.5 12.75 13.5 13 14.25 15.25 14.5 14.5 15 12.5 12.75 This data can be downloaded in serial format using this link: Download CSV Use your statistical software package to conduct a one-factor ANOVA to determine if the group means are equal using a = 0.05. Though not specifically assessed here, you are encouraged to also test the assumptions, plot the group means, and interpret the results. Group means (report to 2 decimal places): Group 1: Internship: Group 2: Co-op: Group 3: Work Study: ANOVA summary statistics: F-ratio = (report accurate to 3 decimal places) (report accurate to 4 decimal places) Conclusion: O The sample data suggest the average starting hourly wages are not the same. O There is not sufficient data to conclude the starting wages are different for the different groups.

MATLAB: An Introduction with Applications
6th Edition
ISBN:9781119256830
Author:Amos Gilat
Publisher:Amos Gilat
Chapter1: Starting With Matlab
Section: Chapter Questions
Problem 1P

Related questions
Question
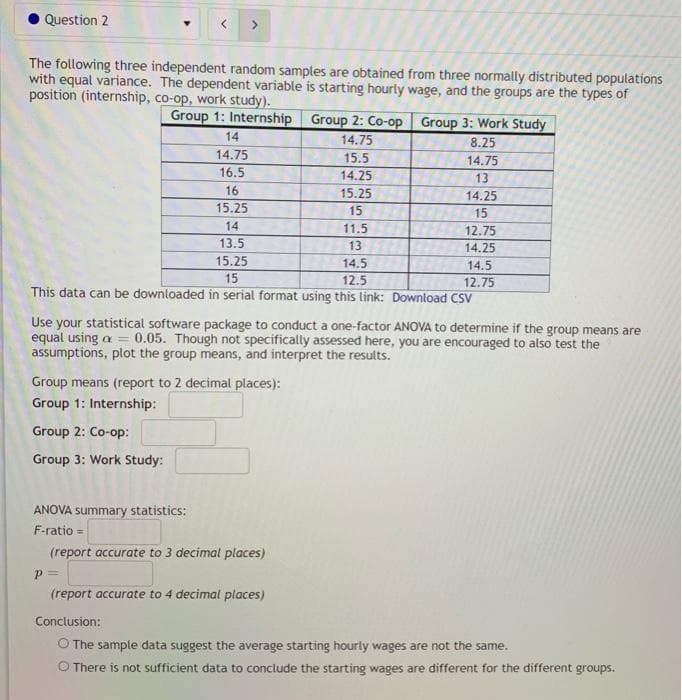
Transcribed Image Text:Question 2
The following three independent random samples are obtained from three normally distributed populations
with equal variance. The dependent variable is starting hourty wage, and the groups are the types of
position (internship, co-op, work study).
Group 1: Internship Group 2: Co-op Group 3: Work Study
14
14.75
8.25
14.75
16.5
15.5
14.75
14.25
13
16
15.25
14.25
15.25
15
15
14
11.5
12.75
13.5
13
14.25
15.25
14.5
14.5
15
12.5
12.75
This data can be downloaded in serial format using this link: Download CSV
Use your statistical software package to conduct a one-factor ANOVA to determine if the group means are
equal using a = 0.05. Though not specifically assessed here, you are encouraged to also test the
assumptions, plot the group means, and interpret the results.
Group means (report to 2 decimal places):
Group 1: Internship:
Group 2: Co-op:
Group 3: Work Study:
ANOVA summary statistics:
F-ratio =
(report accurate to 3 decimal places)
(report accurate to 4 decimal places)
Conclusion:
The sample data suggest the average starting hourly wages are not the same.
There is not sufficient data to conclude the starting wages are different for the different groups.
Expert Solution
This question has been solved!
Explore an expertly crafted, step-by-step solution for a thorough understanding of key concepts.

This is a popular solution!

Trending now
This is a popular solution!

Step by step
Solved in 3 steps with 1 images

Recommended textbooks for you
MATLAB: An Introduction with Applications
Statistics
ISBN:
9781119256830
Author:
Amos Gilat
Publisher:
John Wiley & Sons Inc

Probability and Statistics for Engineering and th…
Statistics
ISBN:
9781305251809
Author:
Jay L. Devore
Publisher:
Cengage Learning

Statistics for The Behavioral Sciences (MindTap C…
Statistics
ISBN:
9781305504912
Author:
Frederick J Gravetter, Larry B. Wallnau
Publisher:
Cengage Learning
MATLAB: An Introduction with Applications
Statistics
ISBN:
9781119256830
Author:
Amos Gilat
Publisher:
John Wiley & Sons Inc
Probability and Statistics for Engineering and th…
Statistics
ISBN:
9781305251809
Author:
Jay L. Devore
Publisher:
Cengage Learning
Statistics for The Behavioral Sciences (MindTap C…
Statistics
ISBN:
9781305504912
Author:
Frederick J Gravetter, Larry B. Wallnau
Publisher:
Cengage Learning

Elementary Statistics: Picturing the World (7th E…
Statistics
ISBN:
9780134683416
Author:
Ron Larson, Betsy Farber
Publisher:
PEARSON

The Basic Practice of Statistics
Statistics
ISBN:
9781319042578
Author:
David S. Moore, William I. Notz, Michael A. Fligner
Publisher:
W. H. Freeman

Introduction to the Practice of Statistics
Statistics
ISBN:
9781319013387
Author:
David S. Moore, George P. McCabe, Bruce A. Craig
Publisher:
W. H. Freeman