Two teaching methods and their effects on science test scores are being reviewed. A random sample of 9 students, taught in traditional lab sessions, had a mean test score of 83.1 with a standard deviation of 5.1. A random sample of 7 students, taught using interactive simulation software, had a mean test score of 87.6 with a standard deviation of 6.4. Do these results support the claim that the mean science test score is lower for students taught in traditional lab sessions than it is for students taught using interactive simulation software? Let be the mean test score for the students taught in traditional lab sessions and μ2 be the mean test score for students taught using interactive simulation software. Use a significance level of α = 0.01 for the test. Assume that the population variances are equal and that the two populations are normally distributed. Step 2 of 4: Compute the value of the t test statistic. Round your answer to three decimal places EB TablesKeypad Answer How to enter your answer Previous Step Answers
Two teaching methods and their effects on science test scores are being reviewed. A random sample of 9 students, taught in traditional lab sessions, had a mean test score of 83.1 with a standard deviation of 5.1. A random sample of 7 students, taught using interactive simulation software, had a mean test score of 87.6 with a standard deviation of 6.4. Do these results support the claim that the mean science test score is lower for students taught in traditional lab sessions than it is for students taught using interactive simulation software? Let be the mean test score for the students taught in traditional lab sessions and μ2 be the mean test score for students taught using interactive simulation software. Use a significance level of α = 0.01 for the test. Assume that the population variances are equal and that the two populations are normally distributed. Step 2 of 4: Compute the value of the t test statistic. Round your answer to three decimal places EB TablesKeypad Answer How to enter your answer Previous Step Answers

Glencoe Algebra 1, Student Edition, 9780079039897, 0079039898, 2018
18th Edition
ISBN:9780079039897
Author:Carter
Publisher:Carter
Chapter4: Equations Of Linear Functions
Section: Chapter Questions
Problem 8SGR

Related questions
Topic Video
Question
How do you solve for the t statistic?
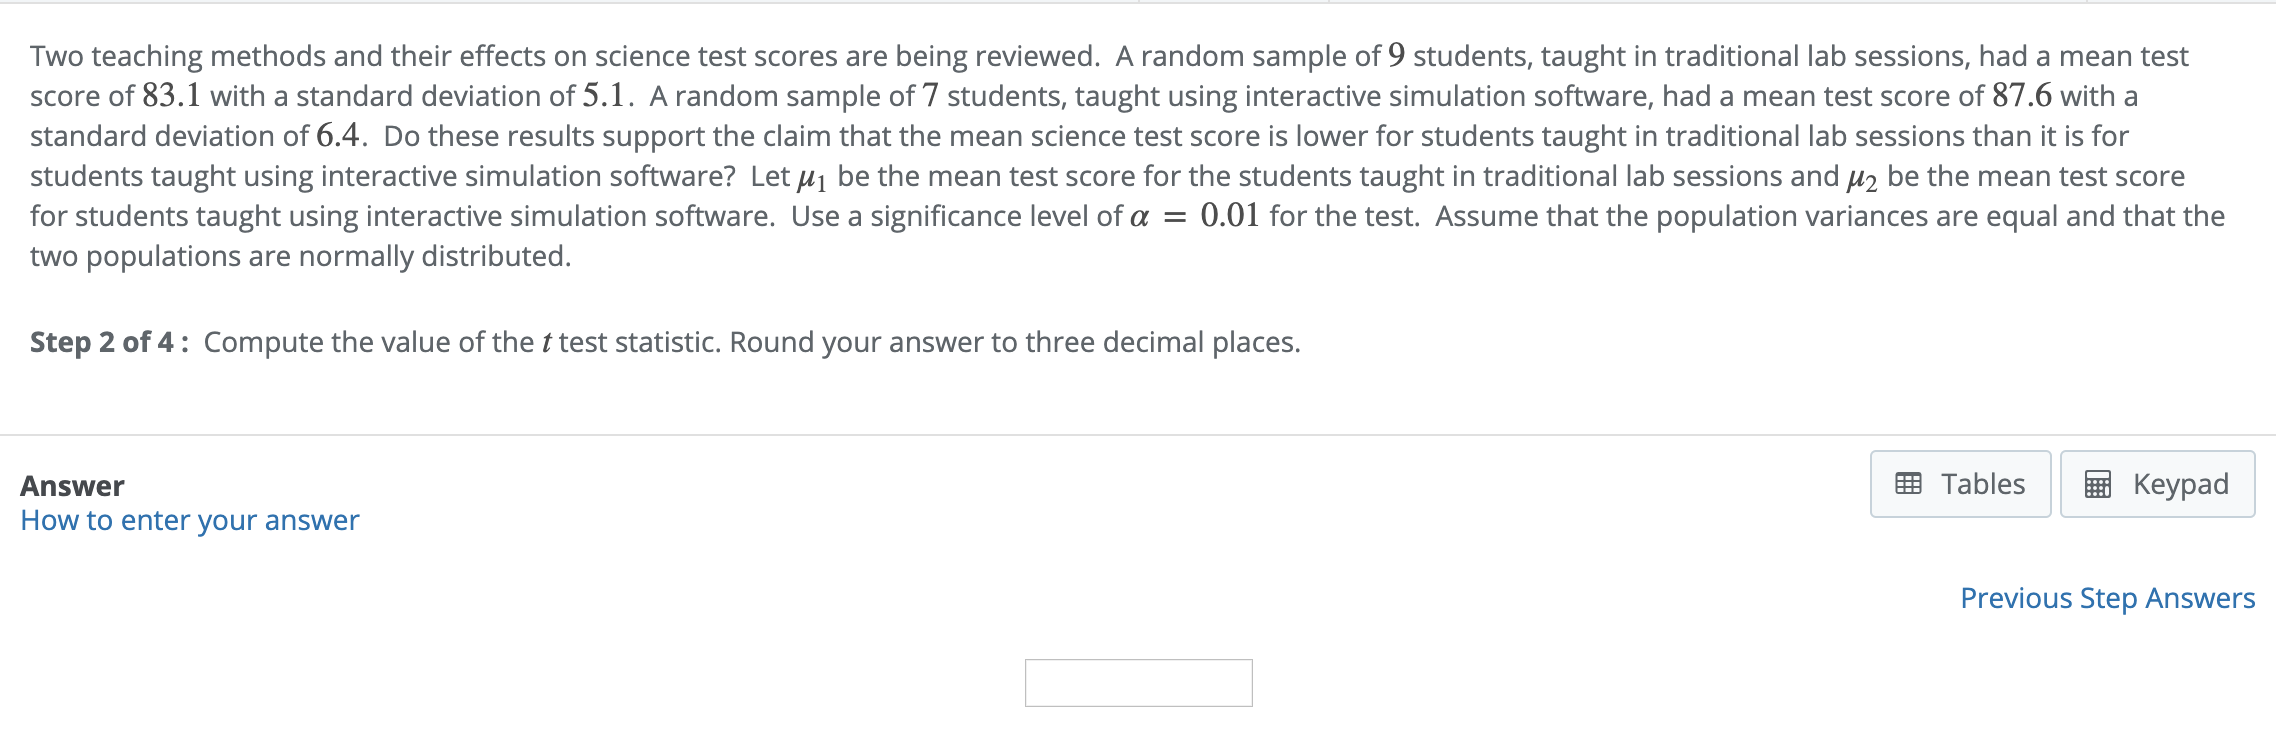
Transcribed Image Text:Two teaching methods and their effects on science test scores are being reviewed. A random sample of 9 students, taught in traditional lab sessions, had a mean test
score of 83.1 with a standard deviation of 5.1. A random sample of 7 students, taught using interactive simulation software, had a mean test score of 87.6 with a
standard deviation of 6.4. Do these results support the claim that the mean science test score is lower for students taught in traditional lab sessions than it is for
students taught using interactive simulation software? Let be the mean test score for the students taught in traditional lab sessions and μ2 be the mean test score
for students taught using interactive simulation software. Use a significance level of α = 0.01 for the test. Assume that the population variances are equal and that the
two populations are normally distributed.
Step 2 of 4: Compute the value of the t test statistic. Round your answer to three decimal places
EB TablesKeypad
Answer
How to enter your answer
Previous Step Answers
Expert Solution
This question has been solved!
Explore an expertly crafted, step-by-step solution for a thorough understanding of key concepts.

This is a popular solution!

Trending now
This is a popular solution!

Step by step
Solved in 5 steps with 4 images

Knowledge Booster


Learn more about
Need a deep-dive on the concept behind this application? Look no further. Learn more about this topic, statistics and related others by exploring similar questions and additional content below.Recommended textbooks for you
Glencoe Algebra 1, Student Edition, 9780079039897…
Algebra
ISBN:
9780079039897
Author:
Carter
Publisher:
McGraw Hill
Glencoe Algebra 1, Student Edition, 9780079039897…
Algebra
ISBN:
9780079039897
Author:
Carter
Publisher:
McGraw Hill