UBERCRUMMIE & FRITCH CO. Formulas/Links: CONSOLIDATED STATEMENTS OF OPERATIONS AND COMPREHENSIVE INCOME Trend Analysis Trend Analysis Common-Size Analysis (In millions, except share and per share amounts) 2019-2020 % Chang n/a n/a n/a 8. 2019-2020 2021 2020 2020-2021 Fiscal Years Ended December 31, 2019 2020-2021 S Change S Change %Change $Change % Change S Change % Change (Percent of Net Sales) 2021 2020 n/a n/a 10 n/a n/a r/a n/a 11 Net sales 5,500 4,240 5,830 /a n/a n/a n/a 12 Cost of Goods Sold 3,680 2,997 3,680 n/a GROSS PROFIT n/a n/a n/a n/a n/a /a n/a n/a n/a n/a n/a 13 n/a Stores and Distribution Expense 1,100 742 990 n/a n/a n/a n/a n/a n/a 14 Selling. General and Administrative Expense Other Operating Expense (Income), Net OPERATING INCOME 440 318 550 15 16 n/a n/a r/a /a n/a n/a 11 21 33 n/a n/a n/a n/a n/a 17 (2) 18 19 Interest Income (Expense) (1) (4) OPERATING INCOME BEFORE TAXES 20 Income Tax Expense 110 74 220 n/a 21 NET INCOME 22 EARNINGS PER SHARE 23 Calculate the following for: Gross Profit Margin (percentage) Net Profit Margin (percentoge) Formulas/Links: n/a 24 2021 2020 n/a 25 n/a n/a 26 27 28 Select the possible explanations for the change in the Gross Profit Margin from 2020 to 2021: 29 30 31
UBERCRUMMIE & FRITCH CO. Formulas/Links: CONSOLIDATED STATEMENTS OF OPERATIONS AND COMPREHENSIVE INCOME Trend Analysis Trend Analysis Common-Size Analysis (In millions, except share and per share amounts) 2019-2020 % Chang n/a n/a n/a 8. 2019-2020 2021 2020 2020-2021 Fiscal Years Ended December 31, 2019 2020-2021 S Change S Change %Change $Change % Change S Change % Change (Percent of Net Sales) 2021 2020 n/a n/a 10 n/a n/a r/a n/a 11 Net sales 5,500 4,240 5,830 /a n/a n/a n/a 12 Cost of Goods Sold 3,680 2,997 3,680 n/a GROSS PROFIT n/a n/a n/a n/a n/a /a n/a n/a n/a n/a n/a 13 n/a Stores and Distribution Expense 1,100 742 990 n/a n/a n/a n/a n/a n/a 14 Selling. General and Administrative Expense Other Operating Expense (Income), Net OPERATING INCOME 440 318 550 15 16 n/a n/a r/a /a n/a n/a 11 21 33 n/a n/a n/a n/a n/a 17 (2) 18 19 Interest Income (Expense) (1) (4) OPERATING INCOME BEFORE TAXES 20 Income Tax Expense 110 74 220 n/a 21 NET INCOME 22 EARNINGS PER SHARE 23 Calculate the following for: Gross Profit Margin (percentage) Net Profit Margin (percentoge) Formulas/Links: n/a 24 2021 2020 n/a 25 n/a n/a 26 27 28 Select the possible explanations for the change in the Gross Profit Margin from 2020 to 2021: 29 30 31

Cornerstones of Financial Accounting
4th Edition
ISBN:9781337690881
Author:Jay Rich, Jeff Jones
Publisher:Jay Rich, Jeff Jones
Chapter12: Fainancial Statement Analysis
Section: Chapter Questions
Problem 99.2C

Related questions

Question
Help
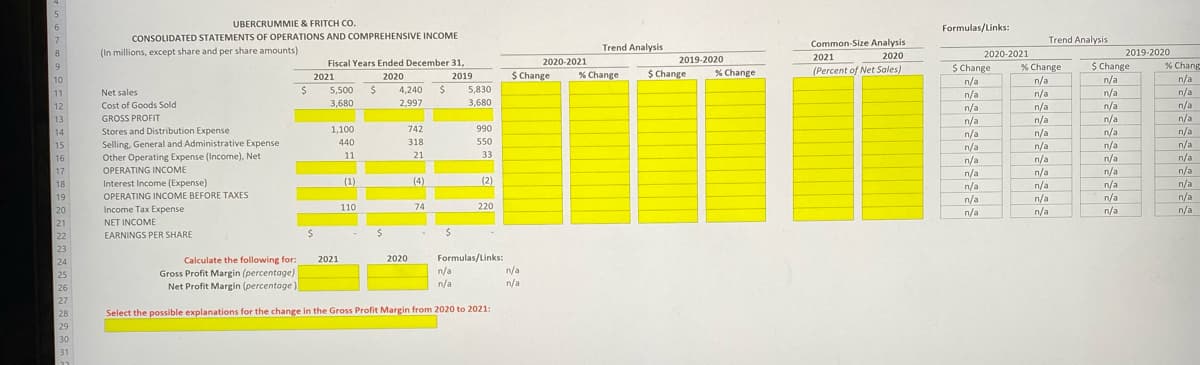
Transcribed Image Text:5
6
UBERCRUMMIE & FRITCH CO.
Formulas/Links
CONSOLIDATED STATEMENTS OF OPERATIONS AND COMPREHENSIVE INCOME
Trend Analysis
Common-Size Analysis
2021
(Percent of Net Sales)
Trend Analysis
8
(In millions, except share and per share amounts)
2019-2020
2020-2021
$ Change
n/a
n/a
n/a
2020
Fiscal Years Ended December 31,
2020-2021
2019-2020
9
% Change
%$ Change
% Chang
2021
2020
$ Change
% Change
$ Change
% Change
2019
n/a
n/a
n/a
n/a
n/a
n/a
10
n/a
n/a
n/a
11
Net sales
5,500
4,240
$4
5,830
12
Cost of Goods Sold
3,680
2,997
3,680
n/a
n/a
n/a
n/a
n/a
n/a
n/a
13
GROSS PROFIT
n/a
n/a
n/a
14
Stores and Distribution Expense
1,100
742
990
n/a
n/a
n/a
n/a
n/a
n/a
n/a
n/a
318
550
Selling, General and Administrative Expense
Other Operating Expense (Income), Net
15
440
n/a
n/a
n/a
n/a
n/a
n/a
n/a
11
21
33
n/a
n/a
n/a
16
17
OPERATING INCOME
(2)
Interest Income (Expense)
OPERATING INCOME BEFORE TAXES
18
(1)
(4)
19
n/a
n/a
110
74
220
Income Tax Expense
NET INCOME
20
n/a
n/a
21
22
EARNINGS PER SHARE
23
Calculate the following for:
Gross Profit Margin (percentage)
Net Profit Margin (percentage)
Formulas/Links:
n/a
n/a
2021
2020
24
n/a
n/a
25
26
27
28
Select the possible explanations for the change in the Gross Profit Margin from 2020 to 2021:
29
30
31
Transcribed Image Text:Nathan Jackson
P Search (Alt+ Q)
AutoSave Oon H
M3 P (2)
Page Layout Formulas Data Review View Help
5 Autosum - Ay O
Home
Insert Draw
X cut
- 11 - A A
8 Wrap Text
Percentage
E Fill
Calibri
Sort & Find &
Analyze
Conditional Format as
Formatting Table Styles
Cell
Insert Delete Format
$ - % > 8 48
Filter Select
Data
LG Copy
E Merge & Center
O Clear
Paste
BIUv
S Format Painter
Celis
Editing
Analyuis
Number
Styles
Alignment
Font
Cipboard
P
R.
K.
D
E
F
G
H
A
Formulas/Links
Trend Analysis
2020-2021
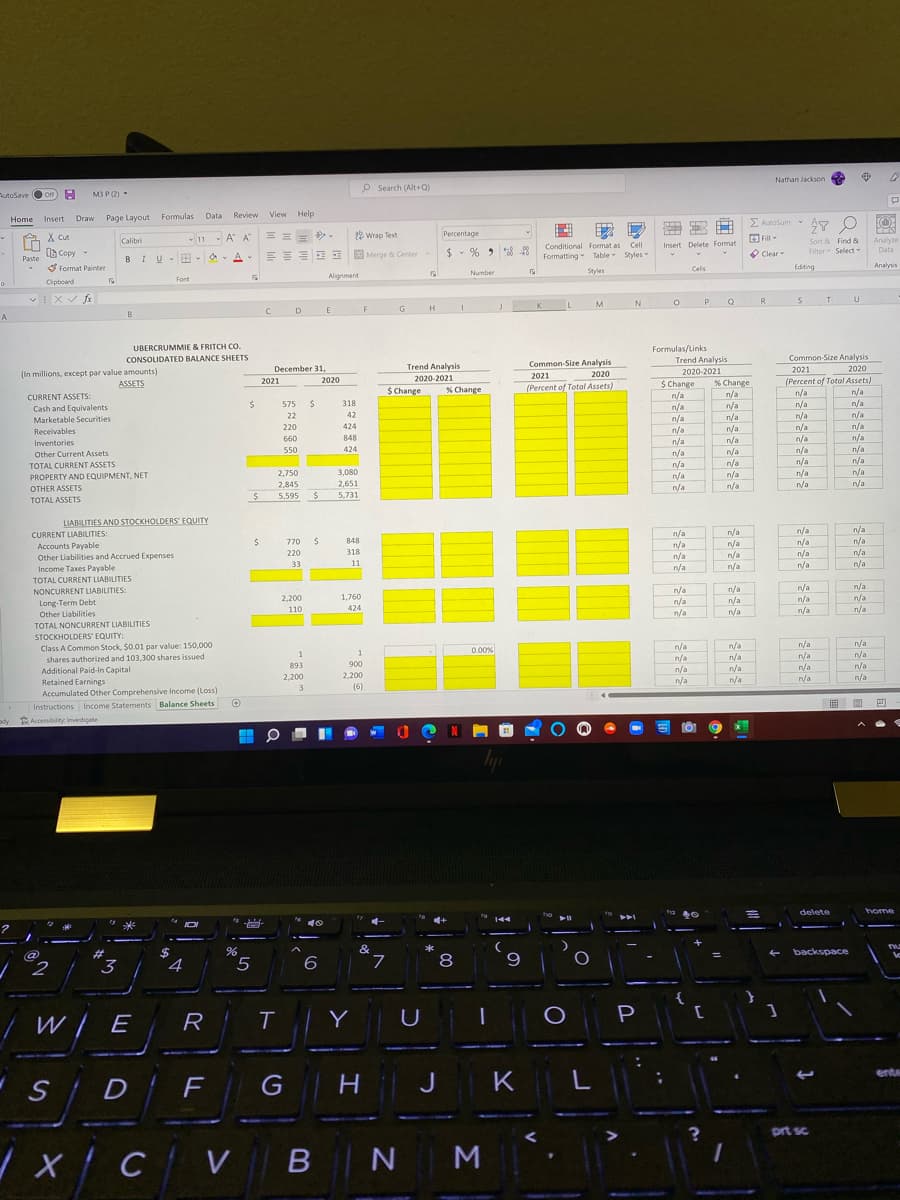
UBERCRUMMIE & FRITCH CO.
Common-Size Analysis
2020
(Percent of Total Assets)
n/a
CONSOLIDATED BALANCE SHEETS
Common-Size Analysis
December 31,
Trend Analysis
2021
(In millions, except par value amounts)
ASSETS
2021
2020
2021
2020
2020-2021
$ Change
n/a
n/a
% Change
n/a
n/a
$ Change
(Percent of Total Assets)
% Change
n/a
CURRENT ASSETS:
575
318
n/a
n/a
Cash and Equivalents
Marketable Securities
22
42
n/a
n/a
n/a
n/a
220
424
n/a
n/a
n/a
n/a
n/a
n/a
n/a
n/a
n/a
Receivables
660
848
n/a
n/a
Inventories
424
n/a
n/a
n/a
n/a
550
n/a
Other Current Assets
TOTAL CURRENT ASSETS
n/a
n/a
2,750
3,080
n/a
n/a
n/a
PROPERTY AND EQUIPMENT, NET
n/a
2,845
2,651
n/a
OTHER ASSETS
n/a
5,595
5,731
TOTAL ASSETS
LIABILITIES AND STOCKHOLDERS' EQUITY
n/a
n/a
n/a
CURRENT LIABILITIES:
Accounts Payable
Other Liabilities and Accrued Expenses
Income Taxes Payable
n/a
n/a
n/a
n/a
n/a
770
848
n/a
n/a
n/a
n/a
220
318
n/a
n/a
n/a
33
11
n/a
TOTAL CURRENT LIABILITIES
n/a
n/a
n/a
n/a
n/a
n/a
n/a
n/a
n/a
n/a
n/a
n/a
NONCURRENT LIABILITIES:
2,200
1,760
Long-Term Debt
Other Liabilities
110
424
TOTAL NONCURRENT LIABILITIES
STOCKHOLDERS' EQUITY:
Class A Common Stock, $0.01 par value: 150,000
shares authorized and 103,300 shares issued
Additional Paid-In Capital
Retained Earnings
Accumulated Other Comprehensive Income (Loss)
n/a
n/a
0.00%
n/a
n/a
n/a
n/a
n/a
n/a
893
900
/a
n/a
n/a
n/a
n/a
2.200
2,200
n/a
n/a
n/a
3.
(6)
|画 ■ 四
Instructions Income Statements Balance Sheets
dy Accessibility Investigate
delete
home
-
#
&
backspace
3.
6
7.
6.
{
/ W/ E
R
Y
U
P
erte
S D
G
H
J
K
L
prt sc
/x/CV B NM
Expert Solution
This question has been solved!
Explore an expertly crafted, step-by-step solution for a thorough understanding of key concepts.

This is a popular solution!

Trending now
This is a popular solution!

Step by step
Solved in 2 steps with 3 images

Knowledge Booster


Learn more about
Need a deep-dive on the concept behind this application? Look no further. Learn more about this topic, accounting and related others by exploring similar questions and additional content below.Recommended textbooks for you
Cornerstones of Financial Accounting
Accounting
ISBN:
9781337690881
Author:
Jay Rich, Jeff Jones
Publisher:
Cengage Learning

Intermediate Accounting: Reporting And Analysis
Accounting
ISBN:
9781337788281
Author:
James M. Wahlen, Jefferson P. Jones, Donald Pagach
Publisher:
Cengage Learning

Financial & Managerial Accounting
Accounting
ISBN:
9781285866307
Author:
Carl Warren, James M. Reeve, Jonathan Duchac
Publisher:
Cengage Learning
Cornerstones of Financial Accounting
Accounting
ISBN:
9781337690881
Author:
Jay Rich, Jeff Jones
Publisher:
Cengage Learning
Intermediate Accounting: Reporting And Analysis
Accounting
ISBN:
9781337788281
Author:
James M. Wahlen, Jefferson P. Jones, Donald Pagach
Publisher:
Cengage Learning
Financial & Managerial Accounting
Accounting
ISBN:
9781285866307
Author:
Carl Warren, James M. Reeve, Jonathan Duchac
Publisher:
Cengage Learning

Survey of Accounting (Accounting I)
Accounting
ISBN:
9781305961883
Author:
Carl Warren
Publisher:
Cengage Learning


Financial Reporting, Financial Statement Analysis…
Finance
ISBN:
9781285190907
Author:
James M. Wahlen, Stephen P. Baginski, Mark Bradshaw
Publisher:
Cengage Learning