uestion list ndard Normal Table (Page 1) 10 - EGATIVE Z Scores 4 Standard Normal (2) Distribution: Cumulative Area from the LEFT 06 .00 0001 0003 0005 0007 0808 ONER 0968 0010 0013 0019 0026 0035 0047 0062 0082 0107 NISS 0139 0179 0228 0287 0281 0359 0351 0446 0436 0548 0537 0668 1751 1357 3587 2719 2420 01 2743 3085 3006 02 0003 0003 0003 0005 0005 0004 0007 0006 0006 0009 0009 0009 0013 0012 0018 0017 0025 0024 0023 0034 0033 0032 0045 0044 0060 0059 0080 0078 0104 0102 0136 0132 www 0174 0170 0217 0274 0344 0427 K 0013 0018 0793 0778 0951 0934 3131 1335 1112 1314 1539 1788 2090 2061 2389 2358 2709 2676 3050 3015 1409 un 1562 1814 03 0418 0516 0655 0643 0630 0764 0043 0057 0079 0099 0129 www 0166 0212 0268 0336 ca 0918 1093 1792 Assume the readings on thermometers are normally distributed with a mean of 0°C and a standard deviation of 1.00°C. Find the probability that a randomly selected thermometer reads between-2.09 and -1.34 and draw a sketch of the region. Click to view page 1 of the table. Click to view page 2 of the table. 1515 1762 2033 2327 2643 2981 TUE 04 0749 ON 0901 3075 3271 3492 3736 05 0003 0003 0003 0003 0004 0004 0004 0004 0006 0006 0006 0005 0008 0008 0008 0008 con 0012 con com 0011 0016 .0016 0015 0023 0022 0021 0031 0030 0029 0041 0040 0039 0055 .0054 0052 0073 .0071 0069 0096 0094 0091 0125 cove 0122 0119 0162 0158 0207 0202 0262 0329 0409 0505 - 0495 0618 0606 0735 0885 1056 1251 1469 2005 2296 2611 2946 100 0256 0322 0401 1711 www 1977 2266 2578 2912 n Bene 0154 0197 0250 0314 0392 0594 0721 CMS 0869 1038 1230 3446 1685 cos 1949 07 2236 2546 2877 m 0015 0021 0028 0038 0051 0066 0089 0116 0150 0192 0244 0708 OBET 0853 1020 1210 3423 3660 www 08 0049 0048 0066 0064 0087 0084 0113 Oro OM6 0143 0188 0183 0239 0233 0307 0301 0294 0384 0375 0367 0475 0465 0582 0571 0694 0638 3005 1190 3401 3635 3894 2177 1922 2206 2514 2843 7199 09 0003 0004 0005 0007 0010 0014 0014 0020 0019 0027 0026 0037 0036 0002 0003 2483 2810 TISE 0005 0007 0010 0455 0559 0681 0823 0985 1170 3579 3611 www 3867 2148 2451 2776 mm X Standard Normal Table (Page 2) 0.0 0.1 02 0.3 04 05 0.6 0.7 0.8 09 10 11 12 13 14 15 16 17 18 19 20 21 22 2.3 24 25 26 27 28 29 30 31 32 L .00 Standard Normal (2) Distribution: Cumulative Area from the LEFT 06 07 04 5160 5557 5948 6331 05 $199 5239 5596 5636 5987 6026 6368 6406 6700 6736 6772 7054 7088 7389 3422 7734 8023 805 8289 8315 8531 8708 8729 8749 8907 8925 8944 9082 9099 9115 9236 9251 9370 9484 9562 9664 9732 8508 9382 9394 9495 9505 9599599 9671 9678 9744 9798 9842 9875 9878 9738 9793 9838 9608 9686 9750 9603 9846 9681 9788 9834 9871 9901 9904 9906 9909 9925 9927 9929 9931 9943 9945 9946 9948 9957 9959 9960 9961 9968 9969 9970 9971 .9977 9977 9978 9979 9983 9984 9994 9985 9908 9909 9989 9992 9992 9992 9994 DOGE 9994 9994 9994 0000 GODK 5000 5398 5793 6179 6554 6915 7257 7580 7881 8159 6628 6985 7324 7642 7939 8212 8461 8686 8888 9049 9066 9207 9345 9222 9357 9478 9573 9656 9726 9783 9830 9868 9898 9920 9922 9938 9940 9941 9953 9965 9974 998 9987 9990 01 02 5040 5080 5438 5478 5832 5871 6217 6255 9452 9554 9641 9713 6950 7291 7611 7910 8186 8438 8665 8413 8643 8849 8869 9032 9192 9332 9564 9649 9719 9772 9778 9821 9826 9861 9864 9893 9896 99108 9955 9956 9966 9967 9975 9982 9987 999 9993 9993 0200 0904 9976 9982 9987 POSITIVE Z Scores 9991 9994 000€ 03 $120 5517 5910 6293 6664 7019 7357 rest 7673 7704 7967 7995 8238 9988 9991 8770 5379 5279 5675 6064 6443 6480 5714 6103 6808 6844 7157 7190 7486 7517 Str 7823 7:23 7454 Cerco 7764 7794 8078 8340 8577 8106 8365 8599 8790 8810 8980 8997 9162 9306 08 9131 9147 9292 9279 9406 9418 9525 9616 9693 9756 9808 9850 9854 9883 9913 9884 9911 www 9932 9934 9949 9951 9972 9979 9985 9989 9429 9535 9625 9699 9761 9812 99629963 9973 9980 9986 9990 9992 9993 9995 9995 DDGE 000€ 09 5359 5753 6517 6879 7224 7549 7852 8133 8.389 8621 8830 9015 9177 9319 9441 9645 9633 9706 9767 9817 9857 .9890 9916 9936 9952 9964 .9974 9981 9906 9990 9993 9995 0097
uestion list ndard Normal Table (Page 1) 10 - EGATIVE Z Scores 4 Standard Normal (2) Distribution: Cumulative Area from the LEFT 06 .00 0001 0003 0005 0007 0808 ONER 0968 0010 0013 0019 0026 0035 0047 0062 0082 0107 NISS 0139 0179 0228 0287 0281 0359 0351 0446 0436 0548 0537 0668 1751 1357 3587 2719 2420 01 2743 3085 3006 02 0003 0003 0003 0005 0005 0004 0007 0006 0006 0009 0009 0009 0013 0012 0018 0017 0025 0024 0023 0034 0033 0032 0045 0044 0060 0059 0080 0078 0104 0102 0136 0132 www 0174 0170 0217 0274 0344 0427 K 0013 0018 0793 0778 0951 0934 3131 1335 1112 1314 1539 1788 2090 2061 2389 2358 2709 2676 3050 3015 1409 un 1562 1814 03 0418 0516 0655 0643 0630 0764 0043 0057 0079 0099 0129 www 0166 0212 0268 0336 ca 0918 1093 1792 Assume the readings on thermometers are normally distributed with a mean of 0°C and a standard deviation of 1.00°C. Find the probability that a randomly selected thermometer reads between-2.09 and -1.34 and draw a sketch of the region. Click to view page 1 of the table. Click to view page 2 of the table. 1515 1762 2033 2327 2643 2981 TUE 04 0749 ON 0901 3075 3271 3492 3736 05 0003 0003 0003 0003 0004 0004 0004 0004 0006 0006 0006 0005 0008 0008 0008 0008 con 0012 con com 0011 0016 .0016 0015 0023 0022 0021 0031 0030 0029 0041 0040 0039 0055 .0054 0052 0073 .0071 0069 0096 0094 0091 0125 cove 0122 0119 0162 0158 0207 0202 0262 0329 0409 0505 - 0495 0618 0606 0735 0885 1056 1251 1469 2005 2296 2611 2946 100 0256 0322 0401 1711 www 1977 2266 2578 2912 n Bene 0154 0197 0250 0314 0392 0594 0721 CMS 0869 1038 1230 3446 1685 cos 1949 07 2236 2546 2877 m 0015 0021 0028 0038 0051 0066 0089 0116 0150 0192 0244 0708 OBET 0853 1020 1210 3423 3660 www 08 0049 0048 0066 0064 0087 0084 0113 Oro OM6 0143 0188 0183 0239 0233 0307 0301 0294 0384 0375 0367 0475 0465 0582 0571 0694 0638 3005 1190 3401 3635 3894 2177 1922 2206 2514 2843 7199 09 0003 0004 0005 0007 0010 0014 0014 0020 0019 0027 0026 0037 0036 0002 0003 2483 2810 TISE 0005 0007 0010 0455 0559 0681 0823 0985 1170 3579 3611 www 3867 2148 2451 2776 mm X Standard Normal Table (Page 2) 0.0 0.1 02 0.3 04 05 0.6 0.7 0.8 09 10 11 12 13 14 15 16 17 18 19 20 21 22 2.3 24 25 26 27 28 29 30 31 32 L .00 Standard Normal (2) Distribution: Cumulative Area from the LEFT 06 07 04 5160 5557 5948 6331 05 $199 5239 5596 5636 5987 6026 6368 6406 6700 6736 6772 7054 7088 7389 3422 7734 8023 805 8289 8315 8531 8708 8729 8749 8907 8925 8944 9082 9099 9115 9236 9251 9370 9484 9562 9664 9732 8508 9382 9394 9495 9505 9599599 9671 9678 9744 9798 9842 9875 9878 9738 9793 9838 9608 9686 9750 9603 9846 9681 9788 9834 9871 9901 9904 9906 9909 9925 9927 9929 9931 9943 9945 9946 9948 9957 9959 9960 9961 9968 9969 9970 9971 .9977 9977 9978 9979 9983 9984 9994 9985 9908 9909 9989 9992 9992 9992 9994 DOGE 9994 9994 9994 0000 GODK 5000 5398 5793 6179 6554 6915 7257 7580 7881 8159 6628 6985 7324 7642 7939 8212 8461 8686 8888 9049 9066 9207 9345 9222 9357 9478 9573 9656 9726 9783 9830 9868 9898 9920 9922 9938 9940 9941 9953 9965 9974 998 9987 9990 01 02 5040 5080 5438 5478 5832 5871 6217 6255 9452 9554 9641 9713 6950 7291 7611 7910 8186 8438 8665 8413 8643 8849 8869 9032 9192 9332 9564 9649 9719 9772 9778 9821 9826 9861 9864 9893 9896 99108 9955 9956 9966 9967 9975 9982 9987 999 9993 9993 0200 0904 9976 9982 9987 POSITIVE Z Scores 9991 9994 000€ 03 $120 5517 5910 6293 6664 7019 7357 rest 7673 7704 7967 7995 8238 9988 9991 8770 5379 5279 5675 6064 6443 6480 5714 6103 6808 6844 7157 7190 7486 7517 Str 7823 7:23 7454 Cerco 7764 7794 8078 8340 8577 8106 8365 8599 8790 8810 8980 8997 9162 9306 08 9131 9147 9292 9279 9406 9418 9525 9616 9693 9756 9808 9850 9854 9883 9913 9884 9911 www 9932 9934 9949 9951 9972 9979 9985 9989 9429 9535 9625 9699 9761 9812 99629963 9973 9980 9986 9990 9992 9993 9995 9995 DDGE 000€ 09 5359 5753 6517 6879 7224 7549 7852 8133 8.389 8621 8830 9015 9177 9319 9441 9645 9633 9706 9767 9817 9857 .9890 9916 9936 9952 9964 .9974 9981 9906 9990 9993 9995 0097

Glencoe Algebra 1, Student Edition, 9780079039897, 0079039898, 2018
18th Edition
ISBN:9780079039897
Author:Carter
Publisher:Carter
Chapter10: Statistics
Section10.3: Measures Of Spread
Problem 4CYU

Related questions
Question
Transcribed Image Text:Question list
Standard Normal Table (Page 1)
-3.50
and
lower
-3.4
-3.3
-3.2
-3.1
NEGATIVE z Scores
-3.0
-2.9
-2.8
-2.7
-2.6
-2.5
-2.4
-2.3
-2.2
-2.1
-2.0
-1.9
-1.8
-1.7
-1.6
-1.5
-1.4
-1.3
-1.2
-1.1
-1.0
-0.9
-0.8
-0.7
-0.6
-0.5
-0.4
.00
Standard Normal (z) Distribution: Cumulative Area from the LEFT
,0001
.0003
.0005
,0007
.0010
.0013
.0019
.0026
.0035
0047
.0062
.0082
.0107
.0139
.0179
0228
.0287
0359
0446
0548
0668
0808
0968
1357
1587
1841
2119
.2420
2743
.3085
3446
.01
0003
.0003
.0005 .0005
0007 .0006
.0009
0009
0013
0013
0018
.0018
.0025
0024
0034
0033
0045
0044
0060 .0059
0080
.0078
0104
0102
0136
0132
0174
0170
0217
0274
0344
0427
0222
0281
0351
0436
0537
0655
0793
.0951
1131
1335
.02
1562
1814
0526
.0643
0778
0934
K
1112
1314
1539
1788
2090 2061
2389
2709
3050
.3409
2358
2676
.3015
3372
.03
.0003
.0004
0006
.0009
.0012
.0017
.0023
.0032
0043
.0057
.0075
.0099
.0129
.0166
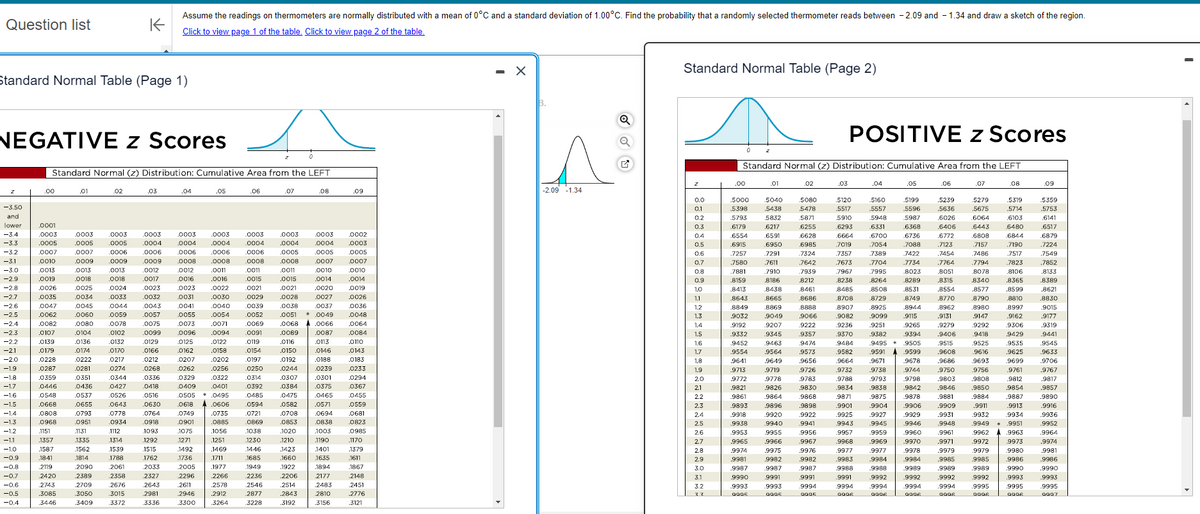
Assume the readings on thermometers are normally distributed with a mean of 0°C and a standard deviation of 1.00°C. Find the probability that a randomly selected thermometer reads between -2.09 and -1.34 and draw a sketch of the region.
Click to view page 1 of the table. Click to view page 2 of the table.
0212
0268
.0336
0418
0516
.0630
0764
.0918
1093
1292
1515
1762
2033
2327
2643
2981
3336
.04
0012
.0016
0023
.0031
0003
.0004 .0004
.0006 ,0006
0008
.0008
0011
.0016
.0022
.0030
.0040
.0054
.0071
.0094
.0122
.0158
.0202
.0256
0322
0401
0041
0055
0073
0096
0125
0162
0207
0262
0329
0409
.05
05050495
1492
1736
2005
2296
.0003 .0003
.0004
0006
0008
.0011
.0015
0021
.0029
0039
0052
.0069
.0091
0119
0154
0197
0250
0314
0392
0485
0594
0618
.0606
0749 .0735
.0901
.0885
1075
1056
1271
2611
2946
.3300
1251
1469
1711
1977
.2266
2578
.2912
06
3264
0721
0869
1038
1230
1446
1685
1949
2236
2546
2877
3228
.07
.0003
.0004
.0005
,0008
0011
.0015
.0021
.0028
.0038
.0051
.0068
.0089
.0116
.0150
0192
.0244
.0307
0384
.0475
.0582
.0708
0853
1020
1210
1423
1660
1922
.2206
2514
.2843
.3192
.08
0003
.0004
,0005
0007
0010
0014
.0020
.0571
.09
.0027
.0026
0037
0036
0049 .0048
.0066
.0064
0087
.0084
0113
.0110
0146
.0143
.0188
0183
0239
0233
.0301
.0294
.0375
.0367
0455
0465
0694
0838
1003
1190
1401
1635
1894
2177
2483
2810
3156
0002
.0003
,0005
.0007
0010
.0014
.0019
.0559
0681
0823
0985
1170
1379
1611
1867
2148
.2451
2776
.3121
X
-2.09 -1.34
U
Standard Normal Table (Page 2)
z
ជ ន ២៩ ៩៩ ៨៩ ៩ ៩ ដ ន – ៩ ៩ ៩ ជ 6 ច ន ជ ន ដ វ ឧ ឧ ឧ ៖ ខ ន ដ ន 2 ៖
Standard Normal (z) Distribution: Cumulative Area from the LEFT
.00
5000
.5398
5793
.6179
.6554
.6915
7257
.7580
.7881
.8159
.8413
.8643
8849
9032
.9192
.9332
9452
.9554
9641
9713
9772
9821
9861
9893
9918
.9938
.9953
.9965
9974
9981
9987
.9990
.9993
0905
.01
5040
5438
5832
6217
6950
7291
7611
7910
.8186
8438
.8665
8869
9049
9207
9345
9463
.9564
.9649
.9719
9778
9826
9864
.9896
9920
9940
9955
.9966
9975
.9982
9987
.9991
9993
0905
.02
5080
5478
5871
6255
6628
.6985
7324
7642
7939
.8212
.8461
8686
8888
.9066
9222
9357
9474
9573
.9656
9726
9783
9830
9868
.9898
9922
9941
9956
9967
9976
9982
9987
.9991
9994
0905
POSITIVE z Scores
.03
5120
5517
5910
.6293
.6664
7019
7357
7673
7967
8238
8485
.8708
8907
9082
.9236
9370
9484
9582
9664
9732
9788
9834
9871
.9901
9925
9943
.9957
.9968
.9977
.9983
9988
.9991
9994
0906
.04
.05
5160
5557
5948
.6331
.6700
.7054
7389
.7704
.7995
.8264
.8508
.8729
8925
.9099
9251
5199
5596
5987
.6368
.6736
.7088
7422
.7734
8023
.8289
.8531
8749
8944
9115
.9265
.9382 .9394
9495 .9505
.9591 .9599
9671
.9678
.9738 .9744
.9793 .9798
.9838 .9842
9875
9878
.9904 .9906
9927 .9929
9945
9946
9959 9960
.9969 .9970
.9977 .9978
.9984 .9984
9988 .9989
.9992 .9992
.9994
9994
9006
9006
.06
.5239
5636
6026
6406
.6772
.7123
7454
7764
8051
.8315
.8554
.8770
.8962
.9131
.9279
.9406
9515
.9608
.9686
.9750
.9803
9846
.9881
.9909
.9931
9948
.9961
.9971
9979
.9985
9989
.9992
.9994
0906
.07
5279
5675
6064
6443
.6808
7157
7486
7794
8078
.8340
.8577
.8790
.8980
.9147
9292
9418
9525
.9616
9693
9756
.9808
.9850
9884
.9911
.9932
.9949
9962
.08
.09
5319
5714
6103
6480
6844
7190
7517
7823
.8106
.8365
.8599
,8810
.8997
9162
9306
9429
9535
.9625
9699
.9761
9812
.9854
.9887
.9913
9934
.9951
9963
9441
9545
.9633
9706
.9767
9817
.9857
.9890
9916
.9936
.9952
9964
9973
.9974
9980
9981
9985 .9986 .9986
9972
9979
9989
9992
.9995
0096
9990
.9993
.9995
0906
.9990
.9993
9995
0907
5359
.5753
6141
.6517
.6879
.7224
.7549
.7852
.8133
.8389
.8621
8830
9015
.9177
9319
Expert Solution
This question has been solved!
Explore an expertly crafted, step-by-step solution for a thorough understanding of key concepts.

Step by step
Solved in 3 steps with 3 images

Recommended textbooks for you
Glencoe Algebra 1, Student Edition, 9780079039897…
Algebra
ISBN:
9780079039897
Author:
Carter
Publisher:
McGraw Hill


Glencoe Algebra 1, Student Edition, 9780079039897…
Algebra
ISBN:
9780079039897
Author:
Carter
Publisher:
McGraw Hill

College Algebra (MindTap Course List)
Algebra
ISBN:
9781305652231
Author:
R. David Gustafson, Jeff Hughes
Publisher:
Cengage Learning