Unit 4 Review Practice 1. Technology required. Data in the table shows the relationship between average number of social network notifications a student receives during one class, x, and average test scores, y. a. According to this data, does the average number of average number of social network notifications, xaverage test score, y 12 92 26 Social network notifications 84 17 87 have any effect on the 43 65 average test score a 57 student receives? Use the 29 75 concepts we have learned in unit 4 to justify your 13 83 100 answer. 16 86 12 73 25 67 22 77 12 89 91 34 98 b. Use the line of best fit to make a prediction about what the test score will be for a student who receives 70 social media notifications during one class. Is this realistic? Explain your answer.
Unit 4 Review Practice 1. Technology required. Data in the table shows the relationship between average number of social network notifications a student receives during one class, x, and average test scores, y. a. According to this data, does the average number of average number of social network notifications, xaverage test score, y 12 92 26 Social network notifications 84 17 87 have any effect on the 43 65 average test score a 57 student receives? Use the 29 75 concepts we have learned in unit 4 to justify your 13 83 100 answer. 16 86 12 73 25 67 22 77 12 89 91 34 98 b. Use the line of best fit to make a prediction about what the test score will be for a student who receives 70 social media notifications during one class. Is this realistic? Explain your answer.

Big Ideas Math A Bridge To Success Algebra 1: Student Edition 2015
1st Edition
ISBN:9781680331141
Author:HOUGHTON MIFFLIN HARCOURT
Publisher:HOUGHTON MIFFLIN HARCOURT
Chapter9: Solving Quadratic Functions
Section: Chapter Questions
Problem 4CA

Related questions
Topic Video
Question
Please explain in 9th grade math:) Also what effect does these variables have in each other? Why do you think this is realistic?
Transcribed Image Text:Unit 4 Review Practice
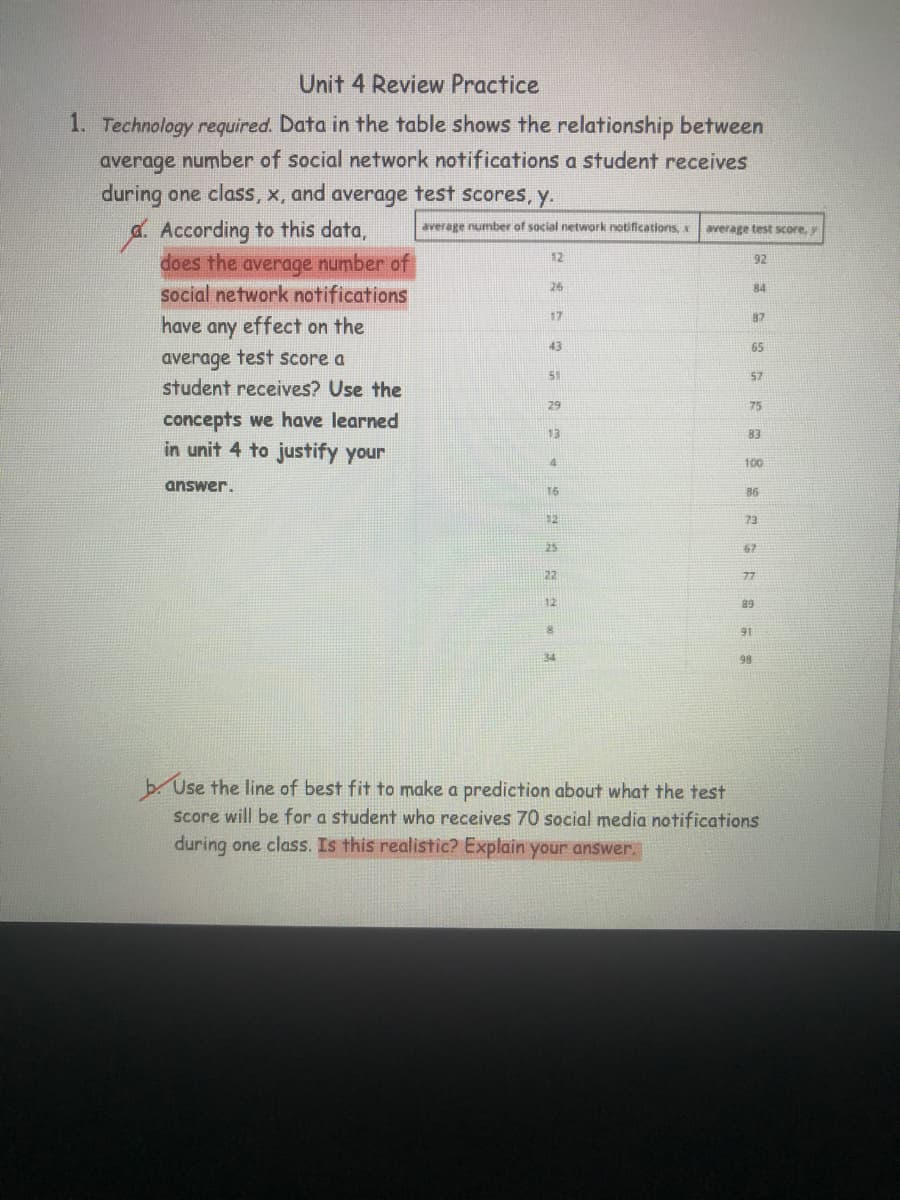
1. Technology required. Data in the table shows the relationship between
average number of social network notifications a student receives
during one class, x, and average test scores, y.
a. According to this data,
does the average number of
social network notifications
average number of social network notifications x
average test score,
12
92
26
84
17
87
have any effect on the
43
65
average test score a
student receives? Use the
51
57
79
75
concepts we have learned
in unit 4 to justify your
13
83
100
answer.
16
86
12
73
25
67
22
77
12
89
91
34
98
b. Use the line of best fit to make a prediction about what the test
score will be for a student who receives 70 social media notifications
during one class. Is this realistic? Explain your answer.
Expert Solution
This question has been solved!
Explore an expertly crafted, step-by-step solution for a thorough understanding of key concepts.

This is a popular solution!

Trending now
This is a popular solution!

Step by step
Solved in 3 steps with 1 images

Knowledge Booster


Learn more about
Need a deep-dive on the concept behind this application? Look no further. Learn more about this topic, statistics and related others by exploring similar questions and additional content below.Recommended textbooks for you
Big Ideas Math A Bridge To Success Algebra 1: Stu…
Algebra
ISBN:
9781680331141
Author:
HOUGHTON MIFFLIN HARCOURT
Publisher:
Houghton Mifflin Harcourt

Glencoe Algebra 1, Student Edition, 9780079039897…
Algebra
ISBN:
9780079039897
Author:
Carter
Publisher:
McGraw Hill

Functions and Change: A Modeling Approach to Coll…
Algebra
ISBN:
9781337111348
Author:
Bruce Crauder, Benny Evans, Alan Noell
Publisher:
Cengage Learning
Big Ideas Math A Bridge To Success Algebra 1: Stu…
Algebra
ISBN:
9781680331141
Author:
HOUGHTON MIFFLIN HARCOURT
Publisher:
Houghton Mifflin Harcourt
Glencoe Algebra 1, Student Edition, 9780079039897…
Algebra
ISBN:
9780079039897
Author:
Carter
Publisher:
McGraw Hill
Functions and Change: A Modeling Approach to Coll…
Algebra
ISBN:
9781337111348
Author:
Bruce Crauder, Benny Evans, Alan Noell
Publisher:
Cengage Learning