University of Florida football programs are printed 1 week prior to each home game. Attendance averages 60,000 screaming and loyal Gators fans, of whom two-thirds usually buy the program, following a normal distribution, for $5 each. Unsold programs are sent to a recycling center that pays only 10 cents per program. The standard deviation is 5,000 programs, and the cost to print each program is $2. Refer to the standard normal table for z-values. a) What is the cost of underestimating demand for each program? Cs = $ (round your response to two decimal places). b) What is the overage cost per program? Co = $ c) How many programs should be ordered per game? programs should be ordered per game (round your response to the nearest whole number). d) What is the stockout risk for this order size? Stockout risk = (round your response to two decimal places). (round your response to four decimal places).
University of Florida football programs are printed 1 week prior to each home game. Attendance averages 60,000 screaming and loyal Gators fans, of whom two-thirds usually buy the program, following a normal distribution, for $5 each. Unsold programs are sent to a recycling center that pays only 10 cents per program. The standard deviation is 5,000 programs, and the cost to print each program is $2. Refer to the standard normal table for z-values. a) What is the cost of underestimating demand for each program? Cs = $ (round your response to two decimal places). b) What is the overage cost per program? Co = $ c) How many programs should be ordered per game? programs should be ordered per game (round your response to the nearest whole number). d) What is the stockout risk for this order size? Stockout risk = (round your response to two decimal places). (round your response to four decimal places).

Practical Management Science
6th Edition
ISBN:9781337406659
Author:WINSTON, Wayne L.
Publisher:WINSTON, Wayne L.
Chapter2: Introduction To Spreadsheet Modeling
Section: Chapter Questions
Problem 20P: Julie James is opening a lemonade stand. She believes the fixed cost per week of running the stand...

Related questions
Question
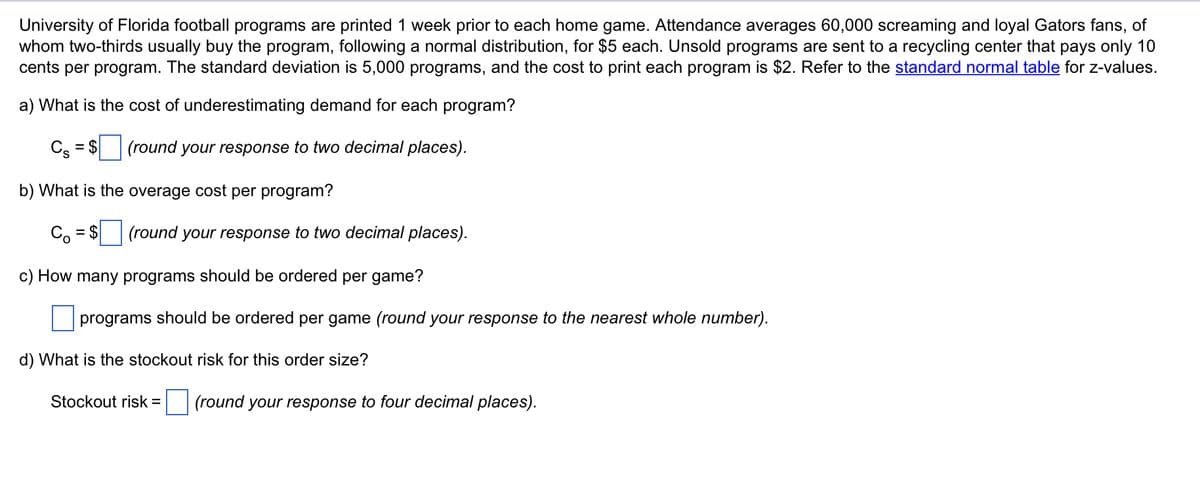
Transcribed Image Text:University of Florida football programs are printed 1 week prior to each home game. Attendance averages 60,000 screaming and loyal Gators fans, of
whom two-thirds usually buy the program, following a normal distribution, for $5 each. Unsold programs are sent to a recycling center that pays only 10
cents per program. The standard deviation is 5,000 programs, and the cost to print each program is $2. Refer to the standard normal table for z-values.
a) What is the cost of underestimating demand for each program?
Cs = $
(round your response to two decimal places).
b) What is the overage cost per program?
Co = $
c) How many programs should be ordered per game?
programs should be ordered per game (round your response to the nearest whole number).
d) What is the stockout risk for this order size?
(round your response to two decimal places).
Stockout risk =
(round your response to four decimal places).
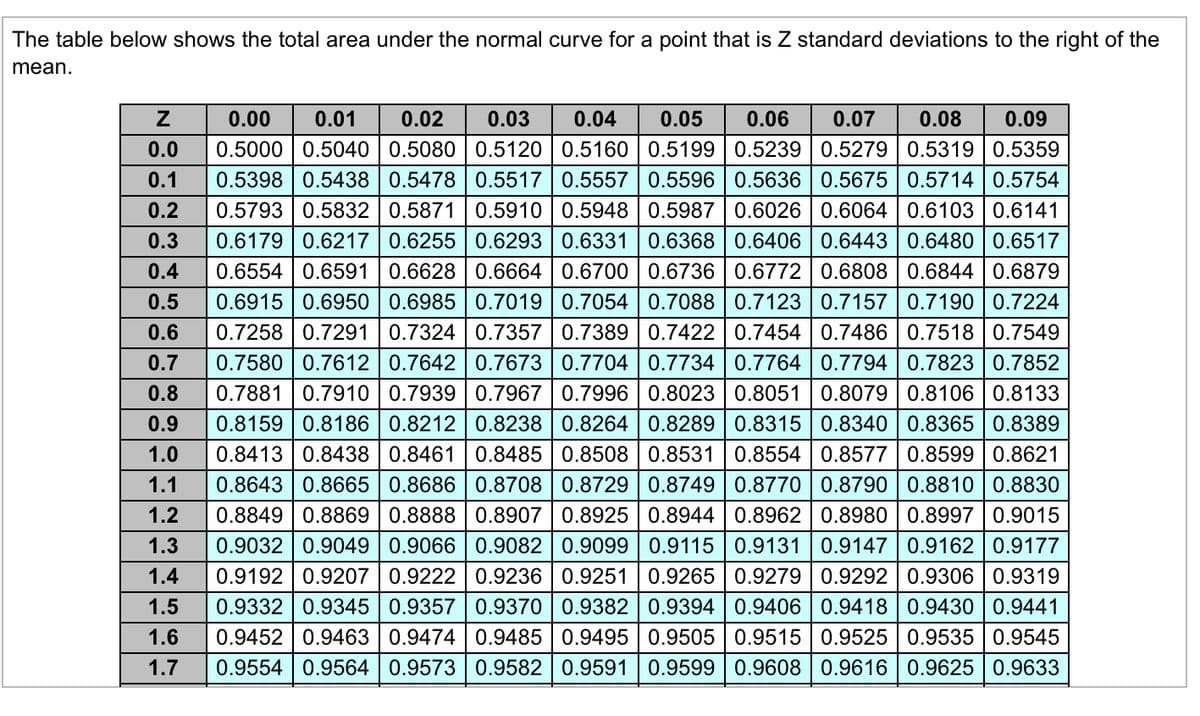
Transcribed Image Text:The table below shows the total area under the normal curve for a point that is Z standard deviations to the right of the
mean.
Z
0.0
0.1
0.00 0.01 0.02 0.03 0.04 0.05 0.06 0.07 0.08 0.09
0.5000 0.5040 0.5080 0.5120 0.5160 0.5199 0.5239 0.5279 0.5319 0.5359
0.5398 0.5438 | 0.5478 0.5517 0.5557 0.5596 0.5636 | 0.5675 0.5714 0.5754
0.5793 0.5832 0.5871 0.5910 0.5948 0.5987 0.6026 0.6064 0.6103 0.6141
0.6179 0.6217 0.6255 0.6293 0.6331 0.6368 0.6406 | 0.6443
0.6554 0.6591 0.6628 0.6664
0.2
0.3
0.6480 | 0.6517
0.4
0.6844 0.6879
0.5
0.7190 0.7224
0.7518 0.7549
0.9
1.0
0.6700 | 0.6736 0.6772 | 0.6808
0.6915 0.6950 0.6985 0.7019 0.7054 0.7088 | 0.7123 | 0.7157
0.6
0.7258 0.7291 0.7324 0.7357 0.7389 0.7422 0.7454 0.7486
0.7 0.7580 0.7612 | 0.7642 | 0.7673 | 0.7704 | 0.7734 | 0.7764 | 0.7794 0.7823 0.7852
0.8 0.7881 0.7910 | 0.7939 0.7967 0.7996 0.8023 0.8051 | 0.8079 0.8106 0.8133
0.8159 0.8186 0.8212 0.8238 0.8264 | 0.8289 0.8315 | 0.8340 | 0.8365 0.8389
0.8413 0.8438 | 0.8461 0.8485 0.8508 0.8531 0.8554 0.8577 | 0.8599 0.8621
0.8643 0.8665 | 0.8686 | 0.8708 | 0.8729 0.8749 0.8770 | 0.8790 | 0.8810 | 0.8830
0.8849 0.8869 0.8888 | 0.8907 | 0.8925 | 0.8944 0.8962 | 0.8980 | 0.8997 0.9015
0.9032 0.9049 0.9066 0.9082 0.9099 0.9115 0.9131 0.9147 0.9162 0.9177
0.9192 0.9207 0.9222 0.9236 0.9251 0.9265 0.9279 0.9292 0.9306 0.9319
1.5 0.9332 0.9345 0.9357 0.9370 0.9382 0.9394 0.9406 0.9418 0.9430 0.9441
1.6 0.9452 0.9463 0.9474 0.9485 0.9495 0.9505 0.9515 0.9525 0.9535 0.9545
1.7 0.9554 0.9564 0.9573 | 0.9582 | 0.9591 0.9599 0.9608 0.9616 0.9625 0.9633
1.1
1.2
1.3
1.4
Expert Solution
This question has been solved!
Explore an expertly crafted, step-by-step solution for a thorough understanding of key concepts.

This is a popular solution!

Trending now
This is a popular solution!

Step by step
Solved in 3 steps with 1 images

Recommended textbooks for you
Practical Management Science
Operations Management
ISBN:
9781337406659
Author:
WINSTON, Wayne L.
Publisher:
Cengage,

Operations Management
Operations Management
ISBN:
9781259667473
Author:
William J Stevenson
Publisher:
McGraw-Hill Education

Operations and Supply Chain Management (Mcgraw-hi…
Operations Management
ISBN:
9781259666100
Author:
F. Robert Jacobs, Richard B Chase
Publisher:
McGraw-Hill Education
Practical Management Science
Operations Management
ISBN:
9781337406659
Author:
WINSTON, Wayne L.
Publisher:
Cengage,
Operations Management
Operations Management
ISBN:
9781259667473
Author:
William J Stevenson
Publisher:
McGraw-Hill Education
Operations and Supply Chain Management (Mcgraw-hi…
Operations Management
ISBN:
9781259666100
Author:
F. Robert Jacobs, Richard B Chase
Publisher:
McGraw-Hill Education


Purchasing and Supply Chain Management
Operations Management
ISBN:
9781285869681
Author:
Robert M. Monczka, Robert B. Handfield, Larry C. Giunipero, James L. Patterson
Publisher:
Cengage Learning

Production and Operations Analysis, Seventh Editi…
Operations Management
ISBN:
9781478623069
Author:
Steven Nahmias, Tava Lennon Olsen
Publisher:
Waveland Press, Inc.