Use either a shift in demand of supply to GRAPHICALLY represent each of the following situations. Also, label the graphs correctly and indicate the changes in equilibrium in each case. a) Avocado prices: Reduced water supply in avocado growing regions. b) Electric car market: Increased gasoline price. c) SUV market: Increased gasoline prices.
Use either a shift in demand of supply to GRAPHICALLY represent each of the following situations. Also, label the graphs correctly and indicate the changes in equilibrium in each case. a) Avocado prices: Reduced water supply in avocado growing regions. b) Electric car market: Increased gasoline price. c) SUV market: Increased gasoline prices.

Chapter4: Demand, Supply, And Markets
Section: Chapter Questions
Problem 6.13P

Related questions
Question
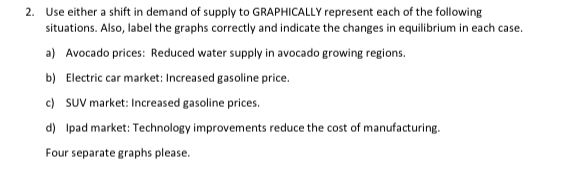
Transcribed Image Text:2. Use either a shift in demand of supply to GRAPHICALLY represent each of the following
situations. Also, label the graphs correctly and indicate the changes in equilibrium in each case.
a) Avocado prices: Reduced water supply in avocado growing regions.
b) Electric car market: Increased gasoline price.
c) SUV market: Increased gasoline prices.
d) Ipad market: Technology improvements reduce the cost of manufacturing.
Four separate graphs please.
Expert Solution
This question has been solved!
Explore an expertly crafted, step-by-step solution for a thorough understanding of key concepts.

Step by step
Solved in 4 steps with 3 images

Knowledge Booster


Learn more about
Need a deep-dive on the concept behind this application? Look no further. Learn more about this topic, economics and related others by exploring similar questions and additional content below.Recommended textbooks for you


Exploring Economics
Economics
ISBN:
9781544336329
Author:
Robert L. Sexton
Publisher:
SAGE Publications, Inc
Exploring Economics
Economics
ISBN:
9781544336329
Author:
Robert L. Sexton
Publisher:
SAGE Publications, Inc


Principles of Microeconomics
Economics
ISBN:
9781305156050
Author:
N. Gregory Mankiw
Publisher:
Cengage Learning

Brief Principles of Macroeconomics (MindTap Cours…
Economics
ISBN:
9781337091985
Author:
N. Gregory Mankiw
Publisher:
Cengage Learning