The graph shows ages of females (labeled 1) and males (labeled 0) who are majoring in psychology in a four-year college. a. Is this a histogram or a bar graph? How do you know? b. What type(s) of graph(s) would be more appropriate? a. Is the graph a histogram or a bar graph? How do you know? OA. The graph is a histogram because the values on the horizontal axis are numbers. OB. The graph is a bar graph because there is a bar shown for each observed category. OC. The graph is a bar graph because the bars are separated. OD. The graph is a histogram because the bars touch. 오호. Count 20- 15- Female 0 Age du. 18 19 20 21 22 25
The graph shows ages of females (labeled 1) and males (labeled 0) who are majoring in psychology in a four-year college. a. Is this a histogram or a bar graph? How do you know? b. What type(s) of graph(s) would be more appropriate? a. Is the graph a histogram or a bar graph? How do you know? OA. The graph is a histogram because the values on the horizontal axis are numbers. OB. The graph is a bar graph because there is a bar shown for each observed category. OC. The graph is a bar graph because the bars are separated. OD. The graph is a histogram because the bars touch. 오호. Count 20- 15- Female 0 Age du. 18 19 20 21 22 25

Glencoe Algebra 1, Student Edition, 9780079039897, 0079039898, 2018
18th Edition
ISBN:9780079039897
Author:Carter
Publisher:Carter
Chapter10: Statistics
Section10.6: Summarizing Categorical Data
Problem 4BGP

Related questions
Question
Q4 ex 2.5
Needed to be solved correctly in 30 minutes and get the thumbs up please provide correct option for this multiple choice question
Answer both parts please
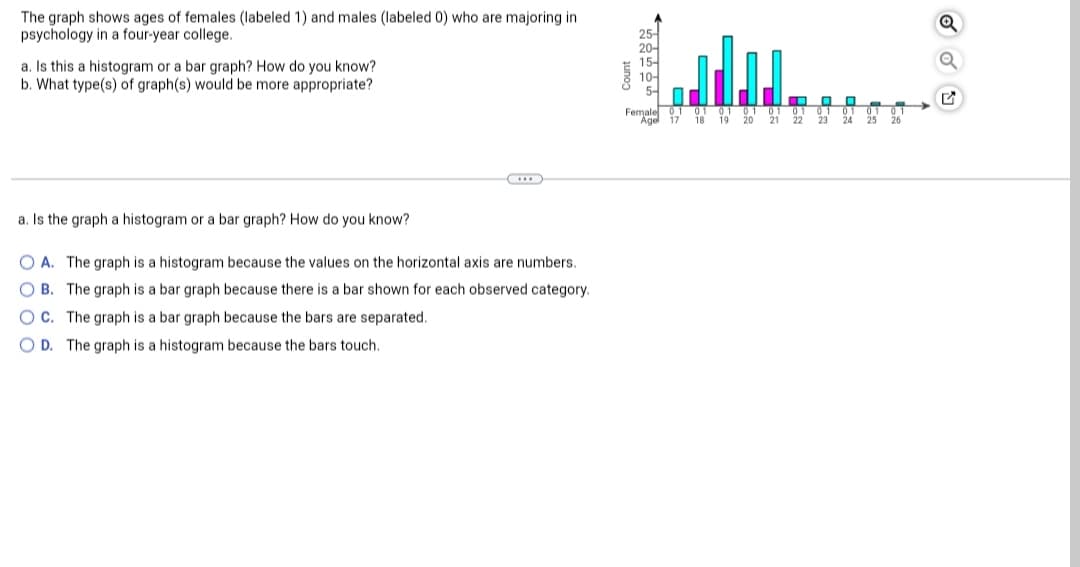
Transcribed Image Text:The graph shows ages of females (labeled 1) and males (labeled 0) who are majoring in
psychology in a four-year college.
a. Is this a histogram or a bar graph? How do you know?
b. What type(s) of graph(s) would be more appropriate?
a. Is the graph a histogram or a bar graph? How do you know?
OA. The graph is a histogram because the values on the horizontal axis are numbers.
OB. The graph is a bar graph because there is a bar shown for each observed category.
OC. The graph is a bar graph because the bars are separated.
D. The graph is a histogram because the bars touch.
25-
20-
15-
10-
Female 17
M
18
19 20
22
23
24 25
Expert Solution
This question has been solved!
Explore an expertly crafted, step-by-step solution for a thorough understanding of key concepts.

This is a popular solution!

Trending now
This is a popular solution!

Step by step
Solved in 2 steps

Recommended textbooks for you
Glencoe Algebra 1, Student Edition, 9780079039897…
Algebra
ISBN:
9780079039897
Author:
Carter
Publisher:
McGraw Hill

College Algebra (MindTap Course List)
Algebra
ISBN:
9781305652231
Author:
R. David Gustafson, Jeff Hughes
Publisher:
Cengage Learning
Glencoe Algebra 1, Student Edition, 9780079039897…
Algebra
ISBN:
9780079039897
Author:
Carter
Publisher:
McGraw Hill
College Algebra (MindTap Course List)
Algebra
ISBN:
9781305652231
Author:
R. David Gustafson, Jeff Hughes
Publisher:
Cengage Learning