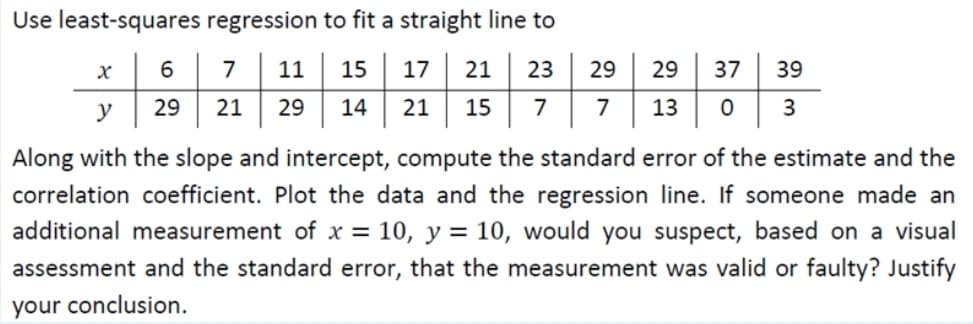
Use least-squares regression to fit a straight line to х 6. 7 11 15 17 21 23 29 29 37 39 y 29 21 29 14 21 15 7 7 13 3 Along with the slope and intercept, compute the standard error of the estimate and the correlation coefficient. Plot the data and the regression line. If someone made an additional measurement of x = 10, y = 10, would you suspect, based on a visual assessment and the standard error, that the measurement was valid or faulty? Justify your conclusion.
Q: The following table shows the length, In centimeters, of the humerus and the total wingspan, In…
A: The regression equation isy^=20.32x+21.05 b)If x=52, theny=20.3252+21.05=1077.69
Q: Given are five observations for two variables, a and y. 4 9 12 14 20 Yi 50 52 40 22 10 The estimated…
A: In regression analysis, by using the terms SSE, SST and SSR we have the following formulae…
Q: Use least-squares regression to fit a straight line to Along with the slope and intercept, compute…
A: Given data for the X and Y variables : X Y 0 5 2 6 4 7 6 6 9 9 11 8 12 7 15 10…
Q: A sales manager collected the following data on x = years of experience and y = annual sales…
A: Given data
Q: A regression was run to determine if there Is a relationship between the happiness index (y) and…
A: In multiple linear regression, there will be more than one independent variable. In simple linear…
Q: Which of the following best describes the relationship of the least squares regression line:…
A: Interpretation of slope coefficient: It is the estimated or expected value of dependent variable (y)…
Q: Given are five observations for two variables, a and y. 3 8 12 18 20 Yi 54 57 50 24 11 The estimated…
A: (a) Use EXCEL to determine the values of SSE, SST and SSR EXCEL procedure: Go to EXCEL Go to…
Q: Obtain the equations of the lines of regression of Y on X from the following data. X : 12 18 24 30…
A: Introduction: Consider that x is the independent variable and y is the dependent variable. The size…
Q: The following data represent the chemistry grades for a random sample of 12 freshmen at a certain…
A: a) Consider a regression function: y=β0+β1x to fit the given data points. Now, we can use the…
Q: For a sample of 8 employees, a personnel director has collected the following data on ownership of…
A: a) Here, x y x-x y-y (x-x)(y-y) (x-x)2 (y-y)2 6 300 -4.5 -151.25 680.625 20.25 22876.56 12…
Q: For a sample of 8 employees, a personnel director has collected the following data on ownership of…
A:
Q: Find the least square regression equation for the data in the table below. x 14 37 43 25 25 25 15…
A: Solution: The given data is
Q: A box office analyst seeks to predict opening weekend box office gross for movies. Toward this…
A: Let β1 denotes the true coefficient of the given regression model. Then, the estimated coefficient…
Q: Assume that variables xx and yy have a significant correlation, and that the line of best fit has…
A: Given , The variables x and y have a significant correlation. The line of best fit is, ( Use…
Q: 1. Formulate the regression equation for the data. 2. What would be the likely blood pressure…
A: The question is about regression Given :
Q: A security firm wants to renew the uniforms used by his personnel. It starts by collecting data on…
A: Step-by-step procedure to find the regression equation using Excel: In Excel sheet, enter Height in…
Q: 2. Given the data with the nutritional content for some bottle of pineapple juice consumed at a…
A:
Q: 14. Find the slope of the equation of the least-squares regression line for the dataset in the table…
A: Formula: The slope can be calculated using formula b=rsysx Calculation: The standard deviation of x…
Q: Interpret the estimated regression coefficient corresponding to the Z variable. Data Salary…
A: Multiple linear regression model: A multiple linear regression model is given as y = b0 + b1x1 +…
Q: The following data represent the number of flash drives sold per day at a local computer shop and…
A: Use EXCEL to obtain the regression equation. EXCEL procedure: Go to EXCEL Go to Data>Data…
Q: A student uses the given set of data to compute a least-squares regression line and a correlation…
A: Here, sample size 'n' is 7. The linear regression line is given by: x y x2 y2 xy 0.7 1 0.49 1…
Q: An academic advisor wants to predict the typical starting salary of a graduate at a top business…
A: For testing whether a linear relationship exists between SALARY and GMAT, we need to test its slope…
Q: M- 06. Use least-squares regression to fit a straight line to 6 11 15 17 21 7 23 29 29 37 39 y 29 21…
A:
Q: a. Use the method of least squares to compute an estimated regression line between sales and…
A:
Q: the data from exercise 2 follow Xi = 3 12 6 20 14 Yi= 55 40 55 10 15 The estimated regression…
A: Given The regression equation is y^=68-3x a)From the given data following calculations are…
Q: For a sample of 8 employees, a personnel director has collected the following data on ownership of…
A: Given, For a sample of 8 employees, a personnel director has collected the following data on…
Q: Use least-squares regression to fit a straight line to 29 21 29 14 21 15 7 7 13 0 3 7 11 15 17 21 23…
A:
Q: Q.1) a) Use least-squares regression to fit a straight line to 11 6 7 6 9 x | 0 4 6 12 15 17 19 y 8…
A: Given: The provided data is: x 0 2 4 6 9 11 12 15 17 19 y 5 6 7 6 9 8 7 10 12 12 The number…
Q: A researcher wants to know if there is a relationship between the number of shopping centers in a…
A: Hello! As you have posted more than 3 sub parts, we are answering the first 3 sub-parts. In case…
Q: 1. For the sample data Scatter Plot 10 9 8 7 4. 3 1 1 5 7 8. 1 3 5 8 y 2 4 6 a. Based on the scatter…
A: a. Scatterplot is a graphical representation between two variables, where each of the points of the…
Q: The following data represent a company’s yearly sales volume and its advertising expenditure over a…
A: Part 1: The scatter diagram of sales versus advertising and is as given below: The above scatter…
Q: A sample has 11 paired observations, Use the xas the independent variable and the y as the dependent…
A:
Q: Compute the least-squares regression line for predicting y from x given the following…
A: The general least-squares regression line is shown below:
Q: Given are five observations for two variables, a and y. 2 8 13 17 20 51 60 46 16 10 The estimated…
A: Solution-: Given data: X Y 2 51 8 60 13 46 17 16 20 10 Given the estimated…
Q: Given are five observations for two variables, x and y. 7 10 15 20 Yi 51 56 40 17 14 The estimated…
A: Solution:- Given the estimated regression equation is, Y^=60.90-2.39*X We have following table: X…
Q: According to the nutrition research, recommendation on the consumption of fiber for children and…
A:
Q: Consider the following table of data. x 0 1 2 y 4 1 0 1 3 4 1 4 (a) Calculate the least squares line…
A: x y xy x^2 X = x-x̄ Y= y - ȳ XY 0 4 0 0 -2 2 -4 1 1 1 1 -1 -1 1 2 0 0 4 0 -2 0 3 1 3 9 1 -1…
Q: 3. Use least-squares regression to fit a straight line to the given data below: 11 12 15 17 19. O 2…
A: The formula for the least squares linear regression is y=mx+b. Here, m=n∑xy-∑x∑yn∑x2-∑x2 and…
Q: The owner of a movie theater company used multiple regression analysis to predict gross revenue (y)…
A: Multiple linear regression model: A multiple linear regression model is given as y = b0 + b1x1 +…
Q: iven are five observations for two variables, x and y. xi 5 9 13 17 20 yi 50 54 46 23 11 The…
A: x y xy x2 y2 5 50 250 25 2500 9 54 486 81 2916 13 46 598 169 2116 17 23 391 289 529…
Q: A market study found that the sales for a firm were related to advertising expenditure, as follows:…
A: Regression Equation = ŷ = bX + a where b is the slope of regression, a is the intercept
Q: Using data from 50 clerical workers, a researcher estimates wage = Bo + ß1Education + B2Experience +…
A:
Q: Suppose Wesley is a marine biologist who is interested in the relationship between the age and the…
A: Given: Y^ = 8.2052+0.5693X Age of the crab, X = 21.7865 Now, Value of Y^ when X=21.7865 Putting the…
Q: A regression between foot length (response variable in cm) and height (explanatory variable in…
A: Given that A regression between foot length (response variable in cm) and height (explanatory…
Q: The following data represent a company’s yearly sales volume and its advertising expenditure over a…
A: 1. In this case Advertising (x) the independent variable and Sales (y) is the dependent variable.…
Q: Calculate the co-efficient of correlation and obtain the least square regression lines for the…
A:
Q: The data below represent commute times (in minutes) and scores on a well-being survey. Commute…
A: x y xy x2 5 69.2 346 25 15 68.4 1026 225 25 67.7 1692.5 625 35 67.3 2355.5 1225…
Q: 12. Use the given data to find the equation of the regression line. Round the final values to three…
A: We consider dexterity to be the dependent variable and productivity to be the independent variable.
Q: A study was conducted to detemine whether a the final grade of a student in an introductory…
A: For the given data Find the least squares line = ? predict y when x = 100
Q: Given are five observations for two variables, x and y. 4 9 12 14 20 50 52 40 22 10 The estimated…
A: (a) Use EXCEL to determine the values of SSE, SST and SSR EXCEL procedure: Go to EXCEL Go to…
Note: You can use excel to solve the problem and convert it to jpg format.
Trending now
This is a popular solution!
Step by step
Solved in 4 steps with 4 images
- The following data show the number of class sessions missed during a semester of SOC221 and the final grade for a sample of 8 students selected at random. Number of Sessions Missed Final Grade (x) (y) 0 96 2 88 12 68 6 91 8…A seafood-sales manager collected data on the maximum daily temperature, T, and the daily revenue from salmon sales, R, using sales receipts for 30 days selected at random. Using the data, the manager conducted a regression analysis and found the least-squares regression line to be Rˆ=126+2.37T. A hypothesis test was conducted to investigate whether there is a linear relationship between maximum daily temperature and the daily revenue from salmon sales. The standard error for the slope of the regression line is SEb1=0.65. Assuming the conditions for inference have been met, which of the following is closest to the value of the test statistic for the hypothesis test? t=0.274 A t=0.65 B t=1.54 C t=3.65 D t=193.85 E2. A company that holds the DVD distribution rights to movies previously released only in theaters wants to estimate sales revenue of DVDs based on box office success. The box office gross (in Php millions) for each of 22 movies in the year that they were released and the DVD revenue (in Php millions) in the following year are shown below and stored in (pic) a. construct a scatter plot. b. assuming a linear relationship, use the least-squares method to determine the regression coefficients b0 and b1.
- Assume a least squares regression line ŷ = 1.6 + 4.5x, with a standard error for the slope of 0.58 calculated from a sample of 35 observations. (a) Which of the following calculates the test statistic for a hypothesis for slope? t = b − x0 s t = b − 0 sb t = x0 − x s/ n t = b − a sb (b) Calculate the test statistic for the hypothesis test for slope. (Round your answer to two decimal places.)A researcher collected data on the cholesterol level, CC, and the age, AA, of 24 people selected at random. Using the data, the researcher calculated the least-squares regression line to be Cˆ=182+2.2AC^=182+2.2A and the standard error of the slope to be 0.38. If the conditions for inference are met, which of the following is closest to the value of the test statistic to test the hypotheses H0:β=0H0:β=0 versus Ha:β≠0Ha:β≠0 ?while using the t-test to test whether regression is significant, in the model yi=β0+β1xi+εiyi=β0+β1xi+εi, what is the calculated student-t statistics (H0:β1=0H0:β1=0 versus H1:β1≠0H1:β1≠0). Calculate the least squares estimates of β0β0 in the model yi=β0+β1xi+εi Calculate the sum of squares of y denoted by Syy , the sum of squares of x denoted by Sxx and sum of squares (products) of x and y denoted by Sxy while using analysis of variance (ANOVA) to test whether regression is significant, in the model yi=β0+β1xi+εiyi=β0+β1xi+εi, what is the residual or error sum of squares due to regression, SSE. kindly help with this question
- A box office analyst seeks to predict opening weekend box office gross for movies. Toward this goal, the analyst plans to use online trailer views as a predictor. For each of the 66 movies, the number of online trailer views from the release of the trailer through the Saturday before a movie opens and the opening weekend box office gross (in millions of dollars) are collected and stored in the accompanying table. Assuming a linear relationship, use the least-squares method to determine the regression coefficients b0 and b1. Interpret the meaning of the slope, b1, in this problem. Predict the mean opening weekend box office gross for a movie that had 80 million online trailer views. What insights can be obtained about predicting opening weekend box office gross from online trailer views?A study of 25 online jewelry retailers was done to find the statistical relationship between the price yyin dollars of a diamond ring and the weight xxin carats of the diamond. Based on this data the following least-squares regression line was found: y^=−6047.75+11975.14xy^=−6047.75+11975.14x One online retailer sells a 3.00 carat diamond ring for 28,999 dollars. What is the residual (error) for the predicted price of a 3.00 carat diamond ring? Give your answer to two decimal places.A random sample of 65 high school seniors was selected from all high school seniors at a certain high school. The following scatterplot shows the height, in centimeters (cm), and the foot length, in cm, for each high school senior from the sample. The least-squares regression line is shown. The computer output from the least-squares regression analysis is also shown. Term Coef(SE) CoefT-ValueP-Value Constant 105.086.0017.510.000 Foot length 2.5990.23810.920.000 S=5.90181R–sq=65.42% (a) Calculate and interpret the residual for the high school senior with a foot length of 20cm and a height of 160cm. BoldItalicUnderlineSuperscriptSubscriptUndoRedoΩBullet listNumbered listImage (12 image limit) Edit imageView imageDelete image Question 2 (b) The standard deviation of the residuals is s=5.9. Interpret the value in context. BoldItalicUnderlineSuperscriptSubscriptUndoRedoΩBullet listNumbered listImage (12 image limit) Edit imageView imageDelete…
- The following data shows the yearly income (in $1000) and age of a sample of seven individuals. Income (in $1000) Age 20 18 24 20 24 23 25 34 26 24 27 27 34 27 Develop the least squares regression equation. Estimate the yearly income of a 30-year old individual. Compute the coefficient of determination. Use a t test to determine whether the slope is significantly different from zero. Use level of significance as 0.05.A company trains its employees with instructional videos and claims that the amount of time, in hours, spent training is linearly related to an increase in productivity. The company selected a random sample of five employees to test its claim. The data were used to create the computer output for a least-squares linear regression, shown in the table. Variable DF Estimate SE Intercept 1 3.6 1.1489 Hours 1 0.8 0.3464 Which of the following is the correct test statistic and number of degrees of freedom? t=2.31 with 4 degrees of freedom A t=2.31 with 3 degrees of freedom B t=2.31 with 5 degrees of freedom C t=3.13 with 1 degree of freedom D t=3.13 with 3 degrees of freedom EThe table below shows the numbers of new-vehicle sales (in thousands) for Company 1 and Company 2 for 11 years. Construct and interpret a 99% prediction interval for new-vehicle sales for Company 2 when the number of new vehicles sold by Company 1 is 2600 thousand. The equation of the regression line is y=1.228x+331.966 Company_1,_x Company_2,_y4093 49293976 48203557 48003411 47323296 46193102 44872859 40482488 38091970 29191625 20021946 2176 Construct and interpret a 99% prediction interval for new-vehicle sales for Company 2 when the number of new vehicles sold by Company 1 is 2600 thousand. Select the correct choice below and fill in the answer boxes to complete your choice. (Round to the nearest cent as needed.) A. There is a 99% chance that the predicted new-vehicle sales for Company 2 is between enter your response here and enter your response here thousand, given that the new-vehicle sales for Company 1 is 2600 thousand.…