The following data represent the chemistry grades for a random sample of 12 freshmen at a certain college along with their scores on an intelligence test administered while they were still seniors in high school. Test score x Chemistry grade y 65 50 55 65 55 70 65 70 55 70 50 55 85 74 76 90 85 87 94 98 81 91 76 74 a) Obtain the least squares estimates of B, and B,and state the estimated regression function. Plot the estimated regression function and the data. Does the estimated regression function appear to fit the data well? c) b) Obtain a point estimate of the chemistry grade which has a test score of 75. d) What is the point estimate of the change in chemistry grade when test score increase by 1 score. e) Interpret the regression coefficient
The following data represent the chemistry grades for a random sample of 12 freshmen at a certain college along with their scores on an intelligence test administered while they were still seniors in high school. Test score x Chemistry grade y 65 50 55 65 55 70 65 70 55 70 50 55 85 74 76 90 85 87 94 98 81 91 76 74 a) Obtain the least squares estimates of B, and B,and state the estimated regression function. Plot the estimated regression function and the data. Does the estimated regression function appear to fit the data well? c) b) Obtain a point estimate of the chemistry grade which has a test score of 75. d) What is the point estimate of the change in chemistry grade when test score increase by 1 score. e) Interpret the regression coefficient

Linear Algebra: A Modern Introduction
4th Edition
ISBN:9781285463247
Author:David Poole
Publisher:David Poole
Chapter7: Distance And Approximation
Section7.3: Least Squares Approximation
Problem 31EQ

Related questions
Question
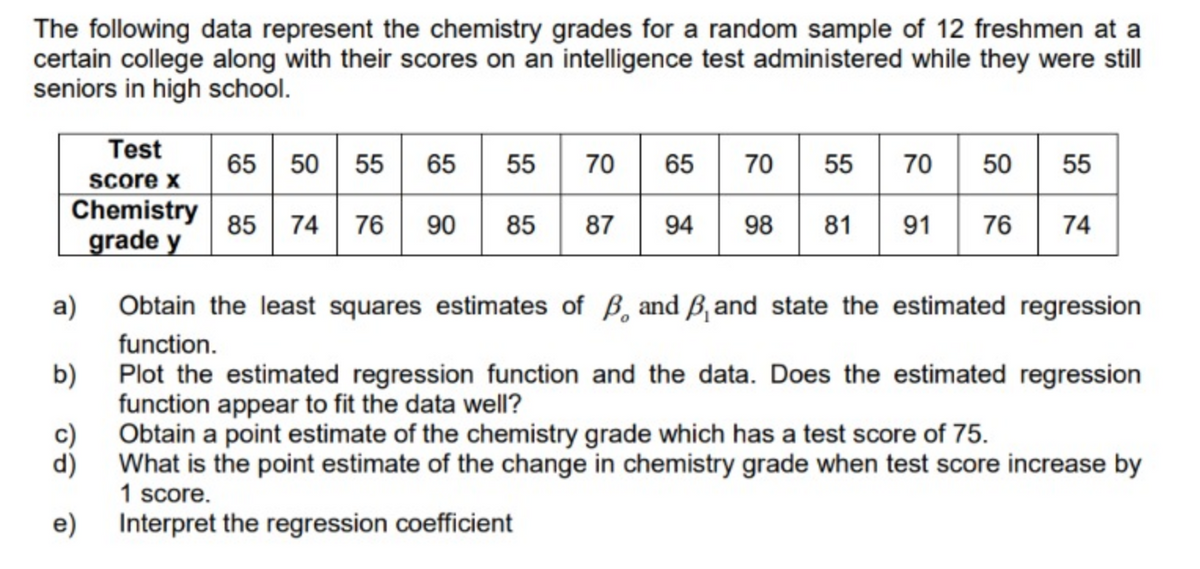
Transcribed Image Text:The following data represent the chemistry grades for a random sample of 12 freshmen at a
certain college along with their scores on an intelligence test administered while they were still
seniors in high school.
Test
score x
Chemistry
grade y
65 50 55 65 55 70
76 90
65 70 55 70 50 55
85 | 74
85
87
94
98
81
91
76
74
а)
Obtain the least squares estimates of B, and B and state the estimated regression
function.
b)
Plot the estimated regression function and the data. Does the estimated regression
function appear to fit the data well?
c)
Obtain a point estimate of the chemistry grade which has a test score of 75.
What is the point estimate of the change in chemistry grade when test score increase by
1 score.
d)
e)
Interpret the regression coefficient
Expert Solution
This question has been solved!
Explore an expertly crafted, step-by-step solution for a thorough understanding of key concepts.

This is a popular solution!

Trending now
This is a popular solution!

Step by step
Solved in 2 steps with 2 images

Recommended textbooks for you
Linear Algebra: A Modern Introduction
Algebra
ISBN:
9781285463247
Author:
David Poole
Publisher:
Cengage Learning

Elementary Linear Algebra (MindTap Course List)
Algebra
ISBN:
9781305658004
Author:
Ron Larson
Publisher:
Cengage Learning
Linear Algebra: A Modern Introduction
Algebra
ISBN:
9781285463247
Author:
David Poole
Publisher:
Cengage Learning
Elementary Linear Algebra (MindTap Course List)
Algebra
ISBN:
9781305658004
Author:
Ron Larson
Publisher:
Cengage Learning