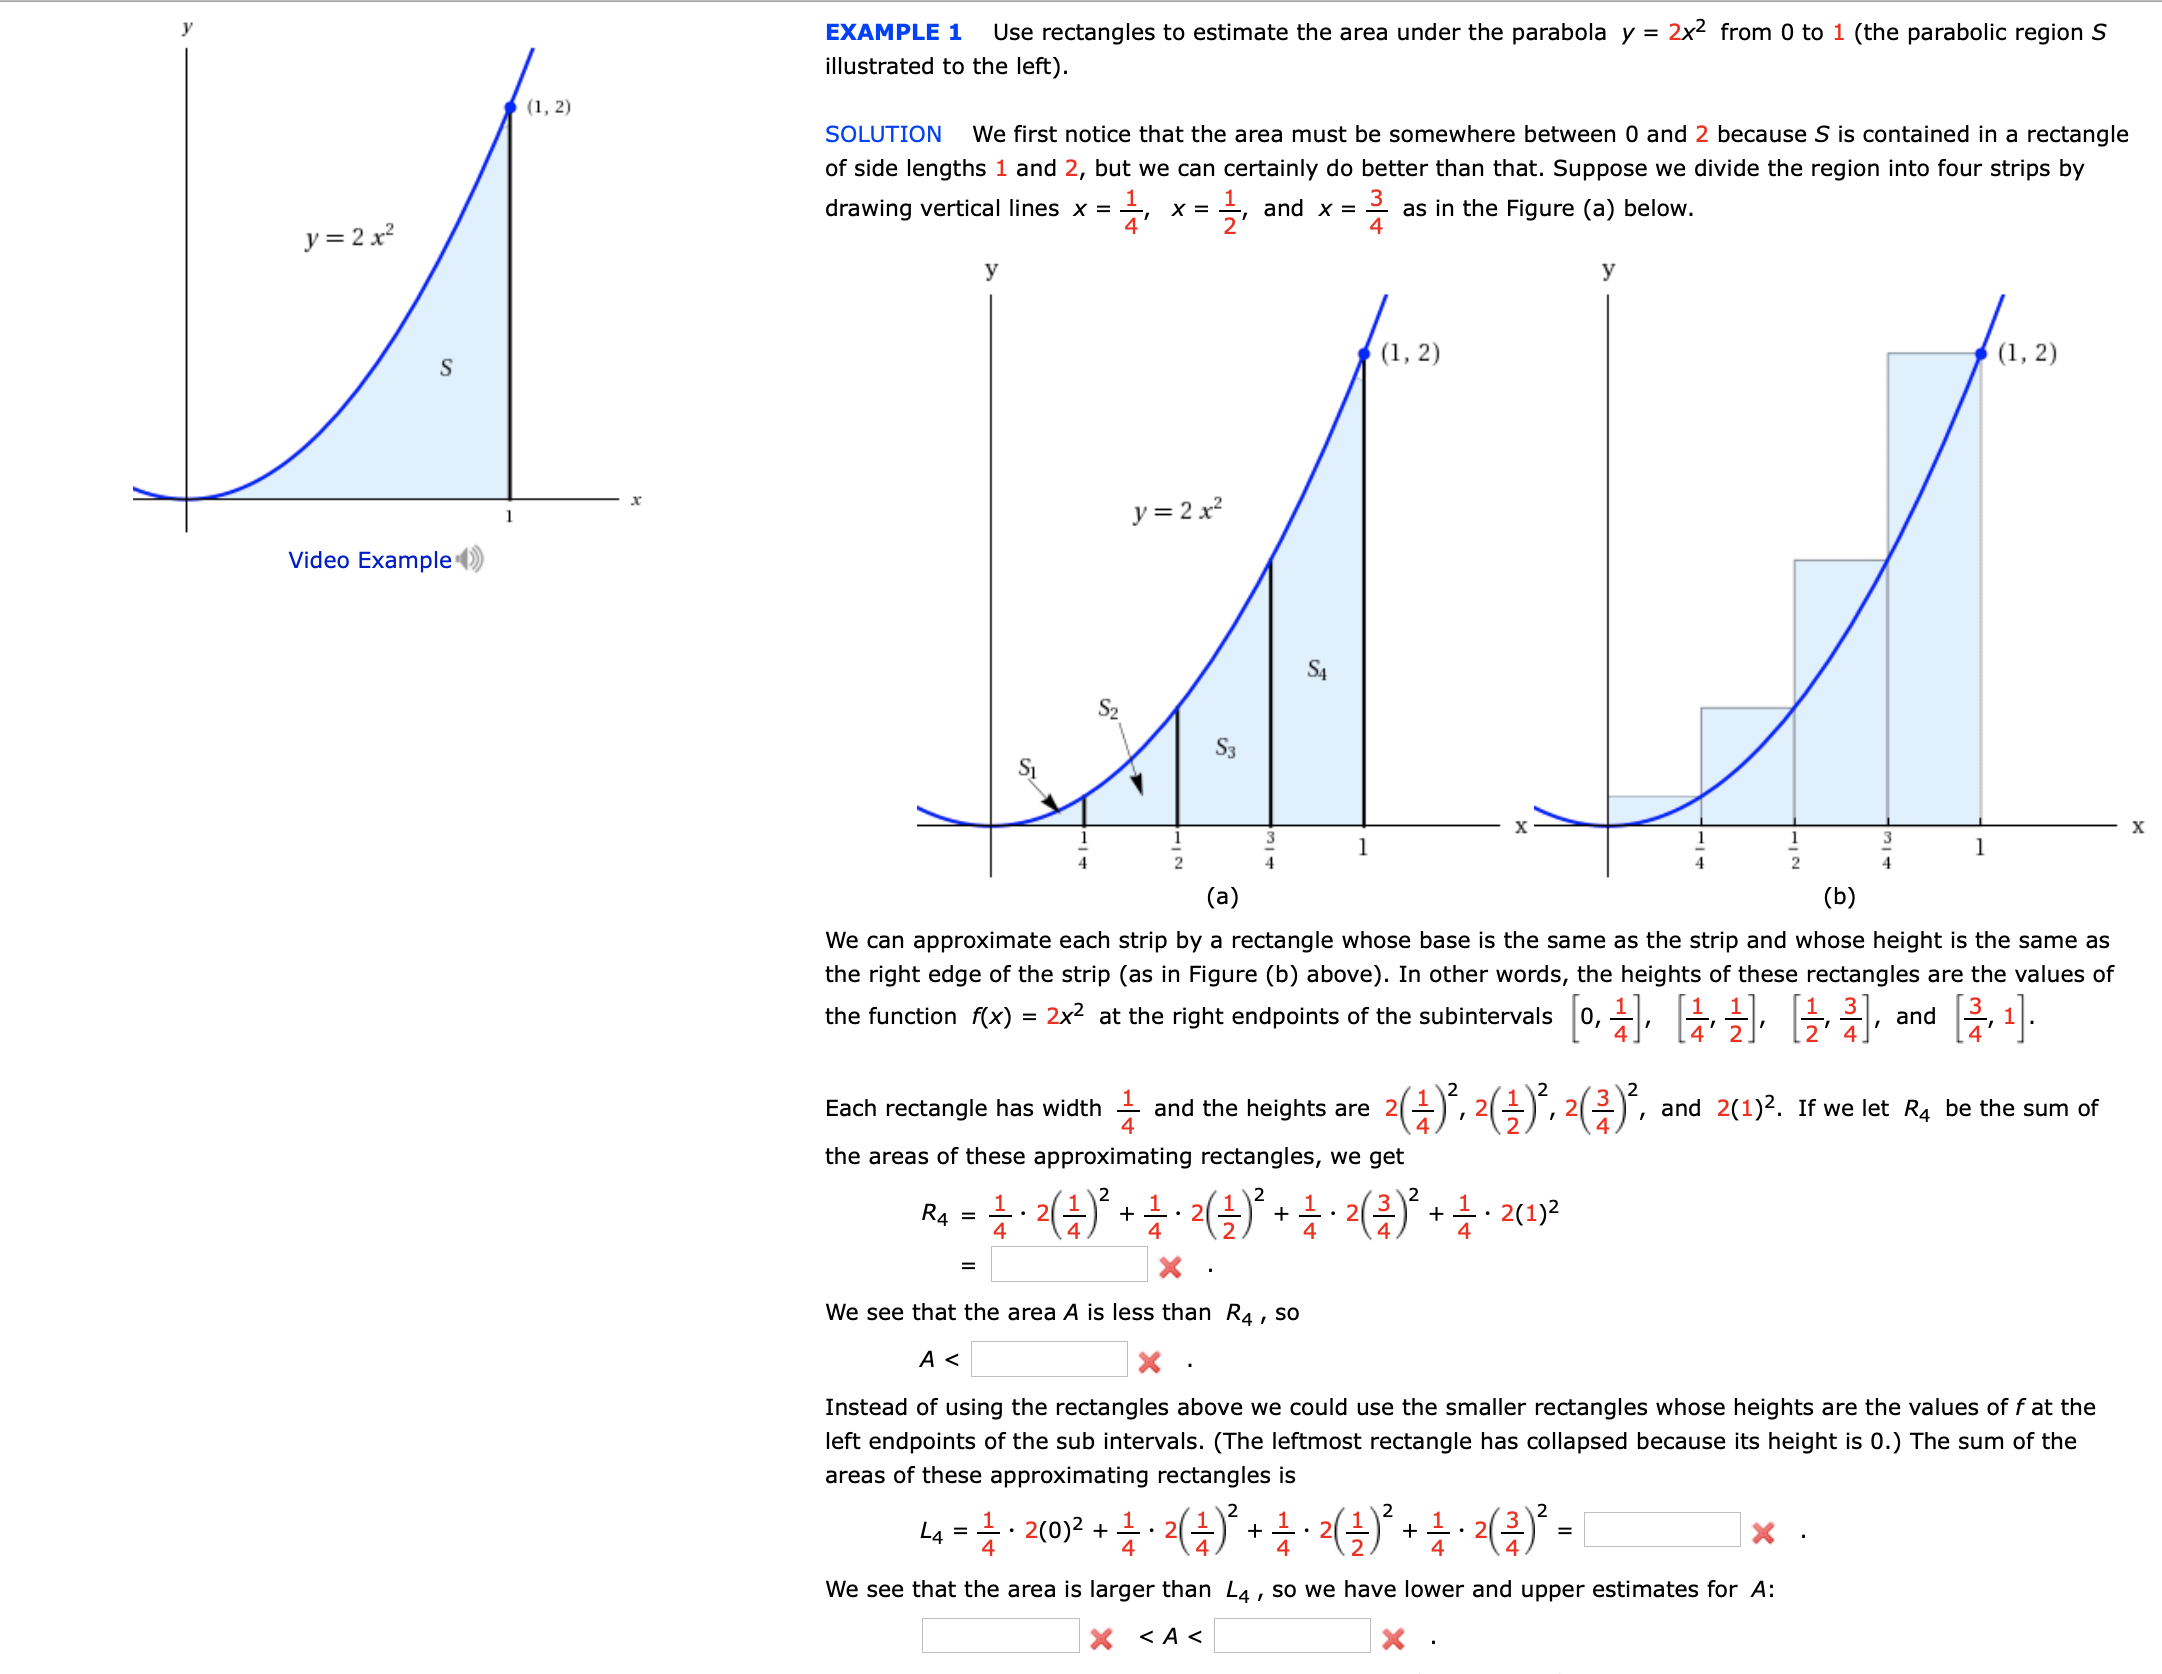
Use rectangles to estimate the area under the parabola y 2x2 from 0 to 1 (the parabolic region S EXAMPLE 1 illustrated to the left) (1, 2) SOLUTION We first notice that the area must be somewhere between 0 and 2 because S is contained in a rectangle of side lengths 1 and 2, but we can certainly do better than that. Suppose we divide the region into four strips by X,and x = - as in the Figure (a) below. 4 drawing vertical lines x = 4 y 2 x2 у У (1, 2) (1, 2) y 2x2 1 Video Example S4 S3 х х 1 1 3 1 1 4 2 4 4 2 4 (a) (b) We can approximate each strip by a rectangle whose base is the same as the strip and whose height is the same as the right edge of the strip (as in Figure (b) above). In other words, the heights of these rectangles are the values of the function f(x) = 2x2 at the right endpoints of the subintervals 0, and and the heights are 2 4 and 2(1)2. If we let R4 be the sum of Each rectangle has width the areas of these approximating rectangles, we get 2 .2 2 . 21) 1 R4 4 4 We see that the area A is less than R4, So A < Instead of using the rectangles above we could use the smaller rectangles whose heights are the values of f at the left endpoints of the sub intervals. (The leftmost rectangle has collapsed because its height is 0.) The sum of the areas of these approximating rectangles is - L4 2(0)2 1 . 4 4 We see that the area is larger than L4, So we have lower and upper estimates for A: X < A < X
Use rectangles to estimate the area under the parabola y 2x2 from 0 to 1 (the parabolic region S EXAMPLE 1 illustrated to the left) (1, 2) SOLUTION We first notice that the area must be somewhere between 0 and 2 because S is contained in a rectangle of side lengths 1 and 2, but we can certainly do better than that. Suppose we divide the region into four strips by X,and x = - as in the Figure (a) below. 4 drawing vertical lines x = 4 y 2 x2 у У (1, 2) (1, 2) y 2x2 1 Video Example S4 S3 х х 1 1 3 1 1 4 2 4 4 2 4 (a) (b) We can approximate each strip by a rectangle whose base is the same as the strip and whose height is the same as the right edge of the strip (as in Figure (b) above). In other words, the heights of these rectangles are the values of the function f(x) = 2x2 at the right endpoints of the subintervals 0, and and the heights are 2 4 and 2(1)2. If we let R4 be the sum of Each rectangle has width the areas of these approximating rectangles, we get 2 .2 2 . 21) 1 R4 4 4 We see that the area A is less than R4, So A < Instead of using the rectangles above we could use the smaller rectangles whose heights are the values of f at the left endpoints of the sub intervals. (The leftmost rectangle has collapsed because its height is 0.) The sum of the areas of these approximating rectangles is - L4 2(0)2 1 . 4 4 We see that the area is larger than L4, So we have lower and upper estimates for A: X < A < X

Trigonometry (MindTap Course List)
10th Edition
ISBN:9781337278461
Author:Ron Larson
Publisher:Ron Larson
Chapter6: Topics In Analytic Geometry
Section6.6: Parametric Equations
Problem 5ECP: Write parametric equations for a cycloid traced by a point P on a circle of radius a as the circle...

Related questions

Question
100%
please answer the blanks
Transcribed Image Text:Use rectangles to estimate the area under the parabola y
2x2 from 0 to 1 (the parabolic region S
EXAMPLE 1
illustrated to the left)
(1, 2)
SOLUTION
We first notice that the area must be somewhere between 0 and 2 because S is contained in a rectangle
of side lengths 1 and 2, but we can certainly do better than that. Suppose we divide the region into four strips by
X,and x = -
as in the Figure (a) below.
4
drawing vertical lines x =
4
y 2 x2
у
У
(1, 2)
(1, 2)
y 2x2
1
Video Example
S4
S3
х
х
1
1
3
1
1
4
2
4
4
2
4
(a)
(b)
We can approximate each strip by a rectangle whose base is the same as the strip and whose height is the same as
the right edge of the strip (as in Figure (b) above). In other words, the heights of these rectangles are the values of
the function f(x) = 2x2 at the right endpoints of the subintervals
0,
and
and the heights are 2
4
and 2(1)2. If we let R4 be the sum of
Each rectangle has width
the areas of these approximating rectangles, we get
2
.2 2 . 21)
1
R4
4
4
We see that the area A is less than R4, So
A <
Instead of using the rectangles above we could use the smaller rectangles whose heights are the values of f at the
left endpoints of the sub intervals. (The leftmost rectangle has collapsed because its height is 0.) The sum of the
areas of these approximating rectangles is
-
L4 2(0)2 1
.
4
4
We see that the area is larger than L4, So we have lower and upper estimates for A:
X < A <
X
Expert Solution
This question has been solved!
Explore an expertly crafted, step-by-step solution for a thorough understanding of key concepts.

This is a popular solution!

Trending now
This is a popular solution!

Step by step
Solved in 4 steps with 2 images

Knowledge Booster


Learn more about
Need a deep-dive on the concept behind this application? Look no further. Learn more about this topic, calculus and related others by exploring similar questions and additional content below.Recommended textbooks for you
Trigonometry (MindTap Course List)
Trigonometry
ISBN:
9781337278461
Author:
Ron Larson
Publisher:
Cengage Learning

Algebra & Trigonometry with Analytic Geometry
Algebra
ISBN:
9781133382119
Author:
Swokowski
Publisher:
Cengage

Elementary Geometry For College Students, 7e
Geometry
ISBN:
9781337614085
Author:
Alexander, Daniel C.; Koeberlein, Geralyn M.
Publisher:
Cengage,
Trigonometry (MindTap Course List)
Trigonometry
ISBN:
9781337278461
Author:
Ron Larson
Publisher:
Cengage Learning
Algebra & Trigonometry with Analytic Geometry
Algebra
ISBN:
9781133382119
Author:
Swokowski
Publisher:
Cengage
Elementary Geometry For College Students, 7e
Geometry
ISBN:
9781337614085
Author:
Alexander, Daniel C.; Koeberlein, Geralyn M.
Publisher:
Cengage,

Algebra: Structure And Method, Book 1
Algebra
ISBN:
9780395977224
Author:
Richard G. Brown, Mary P. Dolciani, Robert H. Sorgenfrey, William L. Cole
Publisher:
McDougal Littell

Mathematics For Machine Technology
Advanced Math
ISBN:
9781337798310
Author:
Peterson, John.
Publisher:
Cengage Learning,