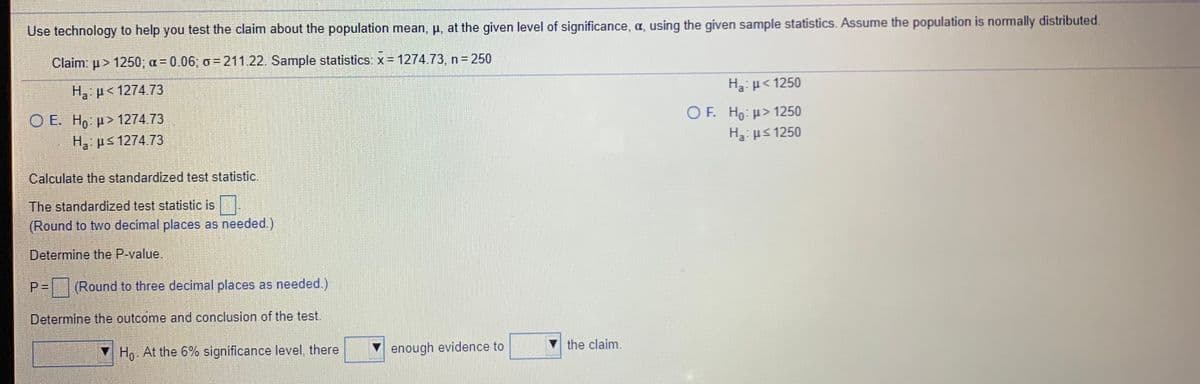
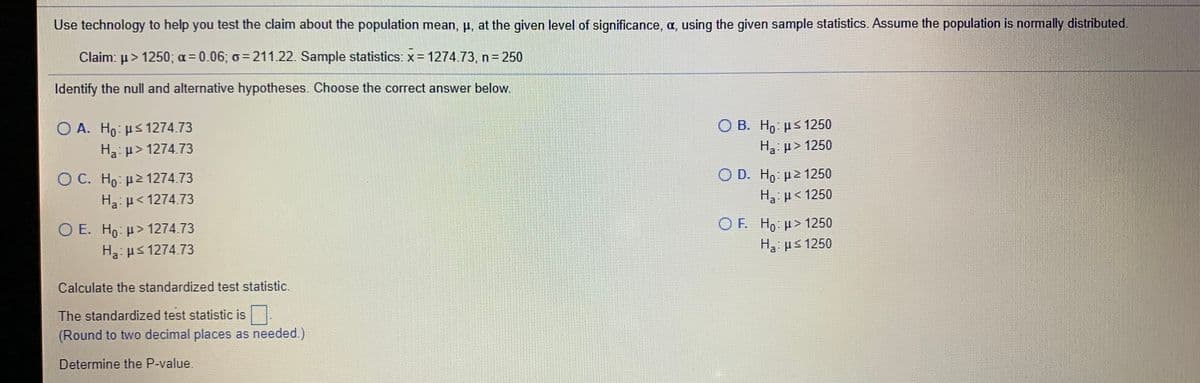
Use technology to help you test the claim about the population mean, u, at the given level of significance, a, using the given sample statistics. Assume the population is normally distributed. Claim: u> 1250; a = 0.06; o = 211.22. Sample statistics: x = 1274.73, n 250 Ha: H< 1274.73 H: u< 1250 O E. Ho: µ> 1274.73 OF. Ha: u> 1250 H, ps 1274.73 H us 1250 Calculate the standardized test statistic. The standardized test statistic is (Round to two decimal places as needed.) Determine the P-value. P = (Round to three decimal places as needed.) Determine the outcome and conclusion of the test. V Họ. At the 6% significance level, there V enough evidence to the claim.

MATLAB: An Introduction with Applications
6th Edition
ISBN:9781119256830
Author:Amos Gilat
Publisher:Amos Gilat
Chapter1: Starting With Matlab
Section: Chapter Questions
Problem 1P
icon
Related questions
icon
Concept explainers
Topic Video
Question
Use technology to help you test the claim about the population mean, p, at the given level of significance, a, using the given sample statistics. Assume the population is normally distributed.
Claim: u > 1250; a = 0.06; o = 211.22. Sample statistics: x= 1274.73, n 250
H p< 1274 73
Ha: p< 1250
O E. H, p> 1274.73
O F. Ho: >1250
Ha ps 1274.73
H3: ps 1250
Calculate the standardized test statistic.
The standardized test statistic is.
(Round to two decimal places as needed.)
Determine the P-value.
Round to three decimal places as needed.)
Determine the outcome and conclusion of the test.
▼ Ho At the 6% significance level, there
V enough evidence to
the claim.
Transcribed Image Text:Use technology to help you test the claim about the population mean, p, at the given level of significance, a, using the given sample statistics. Assume the population is normally distributed. Claim: u > 1250; a = 0.06; o = 211.22. Sample statistics: x= 1274.73, n 250 H p< 1274 73 Ha: p< 1250 O E. H, p> 1274.73 O F. Ho: >1250 Ha ps 1274.73 H3: ps 1250 Calculate the standardized test statistic. The standardized test statistic is. (Round to two decimal places as needed.) Determine the P-value. Round to three decimal places as needed.) Determine the outcome and conclusion of the test. ▼ Ho At the 6% significance level, there V enough evidence to the claim.
Use technology to help you test the claim about the population mean, µ, at the given level of significance, a, using the given sample statistics. Assume the population is normally distributed.
Claim: µ> 1250; a = 0.06; o=211.22. Sample statistics: x 1274.73, n 250
Identify the null and alternative hypotheses. Choose the correct answer below.
O A. Ho: ps1274.73
O B. Ho: ps 1250
Ha: p> 1274.73
Ha p> 1250
O C. Ho: µ2 1274.73
Ha: p< 1274.73
O D. Ho µ2 1250
H p< 1250
O E. Ho: p> 1274.73
O F. Ho p> 1250
Ha ps 1250
Ha: us 1274.73
Calculate the standardized test statistic.
The standardized test statistic is
(Round to two decimal places as needed.)
Determine the P-value.
Transcribed Image Text:Use technology to help you test the claim about the population mean, µ, at the given level of significance, a, using the given sample statistics. Assume the population is normally distributed. Claim: µ> 1250; a = 0.06; o=211.22. Sample statistics: x 1274.73, n 250 Identify the null and alternative hypotheses. Choose the correct answer below. O A. Ho: ps1274.73 O B. Ho: ps 1250 Ha: p> 1274.73 Ha p> 1250 O C. Ho: µ2 1274.73 Ha: p< 1274.73 O D. Ho µ2 1250 H p< 1250 O E. Ho: p> 1274.73 O F. Ho p> 1250 Ha ps 1250 Ha: us 1274.73 Calculate the standardized test statistic. The standardized test statistic is (Round to two decimal places as needed.) Determine the P-value.
Expert Solution
trending now

Trending now

This is a popular solution!

steps

Step by step

Solved in 2 steps with 2 images

Blurred answer
Knowledge Booster
Centre, Spread, and Shape of a Distribution
Learn more about
Need a deep-dive on the concept behind this application? Look no further. Learn more about this topic, statistics and related others by exploring similar questions and additional content below.
Recommended textbooks for you
MATLAB: An Introduction with Applications
Statistics
ISBN:
9781119256830
Author:
Amos Gilat
Publisher:
John Wiley & Sons Inc
Probability and Statistics for Engineering and th…
Statistics
ISBN:
9781305251809
Author:
Jay L. Devore
Publisher:
Cengage Learning
Statistics for The Behavioral Sciences (MindTap C…
Statistics
ISBN:
9781305504912
Author:
Frederick J Gravetter, Larry B. Wallnau
Publisher:
Cengage Learning
Elementary Statistics: Picturing the World (7th E…
Statistics
ISBN:
9780134683416
Author:
Ron Larson, Betsy Farber
Publisher:
PEARSON
The Basic Practice of Statistics
Statistics
ISBN:
9781319042578
Author:
David S. Moore, William I. Notz, Michael A. Fligner
Publisher:
W. H. Freeman
Introduction to the Practice of Statistics
Statistics
ISBN:
9781319013387
Author:
David S. Moore, George P. McCabe, Bruce A. Craig
Publisher:
W. H. Freeman