Use the accompanying Grade Point Averages data to find 90%, 95%, and 99% confidence intervals for the mean GPA. E Click the icon to view the Grade Point Averages data. ..... A 90% confidence interval for the mean GPA is
Use the accompanying Grade Point Averages data to find 90%, 95%, and 99% confidence intervals for the mean GPA. E Click the icon to view the Grade Point Averages data. ..... A 90% confidence interval for the mean GPA is

MATLAB: An Introduction with Applications
6th Edition
ISBN:9781119256830
Author:Amos Gilat
Publisher:Amos Gilat
Chapter1: Starting With Matlab
Section: Chapter Questions
Problem 1P

Related questions
Question
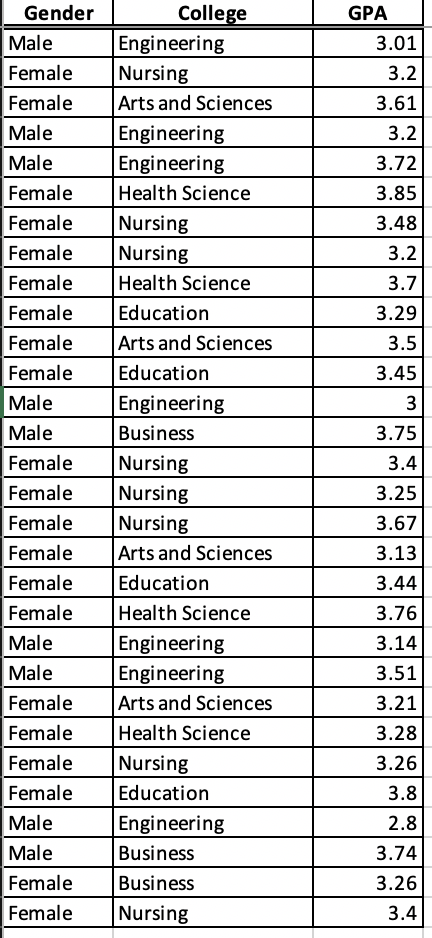
Transcribed Image Text:Gender
College
Engineering
Nursing
GPA
Male
3.01
Female
3.2
Female
Arts and Sciences
3.61
Male
Engineering
3.2
Male
Engineering
Health Science
3.72
Female
3.85
Nursing
Nursing
Health Science
Female
3.48
Female
3.2
Female
3.7
Female
Education
3.29
Female
Arts and Sciences
3.5
Female
Education
3.45
Male
Engineering
Male
Business
3.75
Female
Nursing
3.4
Nursing
Nursing
Arts and Sciences
Female
3.25
Female
3.67
Female
3.13
Female
Education
3.44
Female
Health Science
3.76
Male
Engineering
Engineering
Arts and Sciences
Health Science
3.14
Male
3.51
Female
3.21
Female
3.28
Female
Nursing
3.26
Female
Education
3.8
Male
Engineering
2.8
Male
Business
3.74
Female
Business
3.26
Female
Nursing
3.4
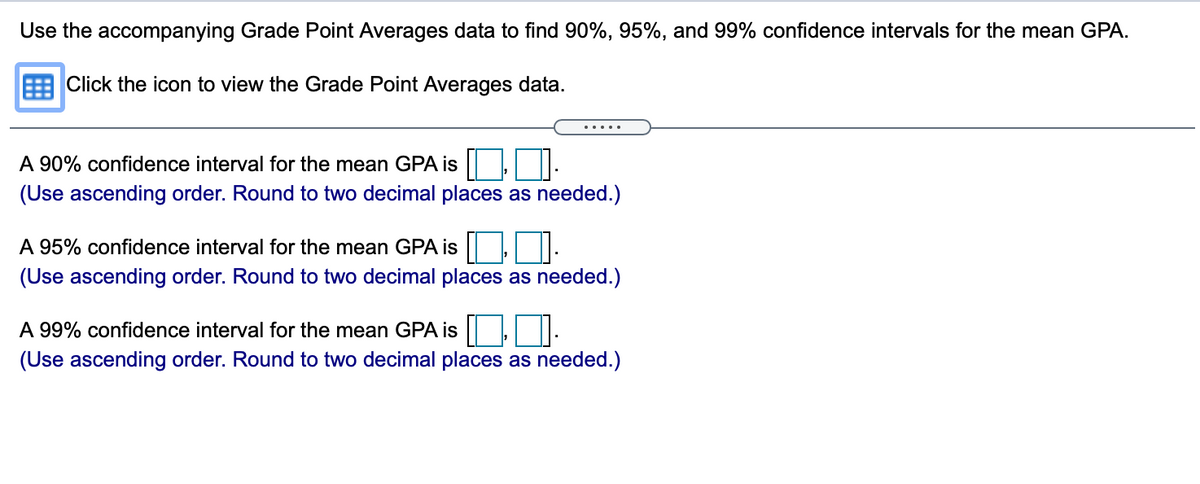
Transcribed Image Text:Use the accompanying Grade Point Averages data to find 90%, 95%, and 99% confidence intervals for the mean GPA.
E Click the icon to view the Grade Point Averages data.
.....
A 90% confidence interval for the mean GPA is |.
(Use ascending order. Round to two decimal places as needed.)
A 95% confidence interval for the mean GPA is ||,.
(Use ascending order. Round to two decimal places as needed.)
A 99% confidence interval for the mean GPA is |:
(Use ascending order. Round to two decimal places as needed.)
Expert Solution
This question has been solved!
Explore an expertly crafted, step-by-step solution for a thorough understanding of key concepts.

This is a popular solution!

Trending now
This is a popular solution!

Step by step
Solved in 2 steps

Recommended textbooks for you
MATLAB: An Introduction with Applications
Statistics
ISBN:
9781119256830
Author:
Amos Gilat
Publisher:
John Wiley & Sons Inc

Probability and Statistics for Engineering and th…
Statistics
ISBN:
9781305251809
Author:
Jay L. Devore
Publisher:
Cengage Learning

Statistics for The Behavioral Sciences (MindTap C…
Statistics
ISBN:
9781305504912
Author:
Frederick J Gravetter, Larry B. Wallnau
Publisher:
Cengage Learning
MATLAB: An Introduction with Applications
Statistics
ISBN:
9781119256830
Author:
Amos Gilat
Publisher:
John Wiley & Sons Inc
Probability and Statistics for Engineering and th…
Statistics
ISBN:
9781305251809
Author:
Jay L. Devore
Publisher:
Cengage Learning
Statistics for The Behavioral Sciences (MindTap C…
Statistics
ISBN:
9781305504912
Author:
Frederick J Gravetter, Larry B. Wallnau
Publisher:
Cengage Learning

Elementary Statistics: Picturing the World (7th E…
Statistics
ISBN:
9780134683416
Author:
Ron Larson, Betsy Farber
Publisher:
PEARSON

The Basic Practice of Statistics
Statistics
ISBN:
9781319042578
Author:
David S. Moore, William I. Notz, Michael A. Fligner
Publisher:
W. H. Freeman

Introduction to the Practice of Statistics
Statistics
ISBN:
9781319013387
Author:
David S. Moore, George P. McCabe, Bruce A. Craig
Publisher:
W. H. Freeman