Use the box plot below to find each of the values: Minimum: First Quartile (Q1): Median: + 70 74 78 82 86 90 94 Third Quartile (Q3): Math Test Scores Maximum: Interquartile Range (IQR = Q3-Q1):
Use the box plot below to find each of the values: Minimum: First Quartile (Q1): Median: + 70 74 78 82 86 90 94 Third Quartile (Q3): Math Test Scores Maximum: Interquartile Range (IQR = Q3-Q1):

Big Ideas Math A Bridge To Success Algebra 1: Student Edition 2015
1st Edition
ISBN:9781680331141
Author:HOUGHTON MIFFLIN HARCOURT
Publisher:HOUGHTON MIFFLIN HARCOURT
Chapter11: Data Analysis And Displays
Section: Chapter Questions
Problem 6CR

Related questions

Question
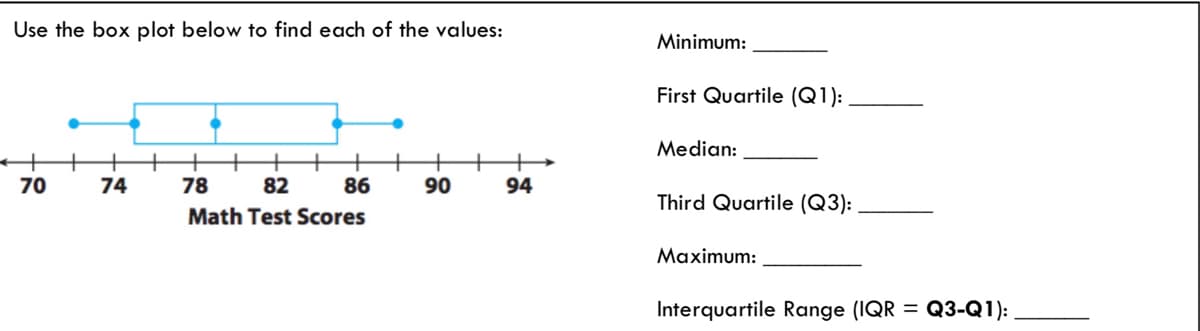
Transcribed Image Text:Use the box plot below to find each of the values:
Minimum:
First Quartile (Q1):
Median:
+
86
90
70
74
78
82
94
Third Quartile (Q3):
Math Test Scores
Maximum:
Interquartile Range (IQR = Q3-Q1):
Expert Solution
This question has been solved!
Explore an expertly crafted, step-by-step solution for a thorough understanding of key concepts.

This is a popular solution!

Trending now
This is a popular solution!

Step by step
Solved in 2 steps with 2 images

Knowledge Booster


Learn more about
Need a deep-dive on the concept behind this application? Look no further. Learn more about this topic, advanced-math and related others by exploring similar questions and additional content below.Recommended textbooks for you
Big Ideas Math A Bridge To Success Algebra 1: Stu…
Algebra
ISBN:
9781680331141
Author:
HOUGHTON MIFFLIN HARCOURT
Publisher:
Houghton Mifflin Harcourt

Glencoe Algebra 1, Student Edition, 9780079039897…
Algebra
ISBN:
9780079039897
Author:
Carter
Publisher:
McGraw Hill
Big Ideas Math A Bridge To Success Algebra 1: Stu…
Algebra
ISBN:
9781680331141
Author:
HOUGHTON MIFFLIN HARCOURT
Publisher:
Houghton Mifflin Harcourt
Glencoe Algebra 1, Student Edition, 9780079039897…
Algebra
ISBN:
9780079039897
Author:
Carter
Publisher:
McGraw Hill