Use the calibration curve or linear regression equation to determine the concentration of FD&C blue dye No. 1 in Kool-aid. Food Coloring is 0.026 M in FD&C blue dye No. 1 7.5 x 10 -5 M is 29 mL -> 1000 mL
Use the calibration curve or linear regression equation to determine the concentration of FD&C blue dye No. 1 in Kool-aid. Food Coloring is 0.026 M in FD&C blue dye No. 1 7.5 x 10 -5 M is 29 mL -> 1000 mL

Chapter10: Effect Of Electrolytes On Chemical Equilibria
Section: Chapter Questions
Problem 10.7QAP

Related questions
Question
Use the calibration curve or linear regression equation to determine the concentration of
FD&C blue dye No. 1 in Kool-aid.
Food Coloring is 0.026 M in FD&C blue dye No. 1
7.5 x 10 -5 M is 29 mL -> 1000 mL
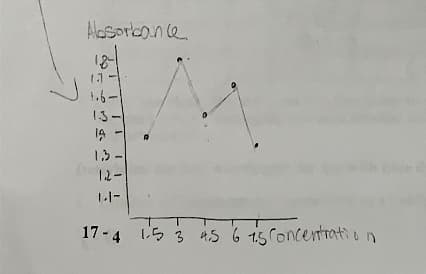
Transcribed Image Text:Absorbance
1.3
1.6-
13-
14
1,3-
1.2.
17-4 5 3 4.5 6 15 Concentration
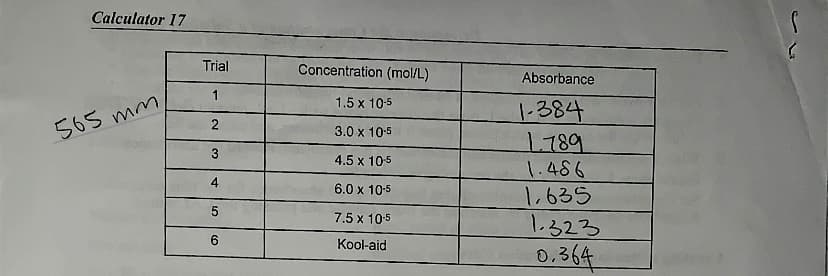
Transcribed Image Text:Calculator 17
565 mm,
Trial
1
3
4
5
6
Concentration (mol/L)
1.5 x 10⁻⁵
3.0 x 10⁻⁵
4.5 x 10⁻⁵
6.0 x 10⁻⁵
7.5 x 10⁻⁵
Kool-aid
Absorbance
1-384
1.789
1.486
1,635
1.323
0.364
Expert Solution
This question has been solved!
Explore an expertly crafted, step-by-step solution for a thorough understanding of key concepts.

This is a popular solution!

Trending now
This is a popular solution!

Step by step
Solved in 2 steps with 1 images

Knowledge Booster


Learn more about
Need a deep-dive on the concept behind this application? Look no further. Learn more about this topic, chemistry and related others by exploring similar questions and additional content below.Recommended textbooks for you

Principles of Instrumental Analysis
Chemistry
ISBN:
9781305577213
Author:
Douglas A. Skoog, F. James Holler, Stanley R. Crouch
Publisher:
Cengage Learning
Principles of Instrumental Analysis
Chemistry
ISBN:
9781305577213
Author:
Douglas A. Skoog, F. James Holler, Stanley R. Crouch
Publisher:
Cengage Learning