Use the figure below to answer the following question(s). Figure 3-14 S1 't DI Qi Quantity of Gasoline 
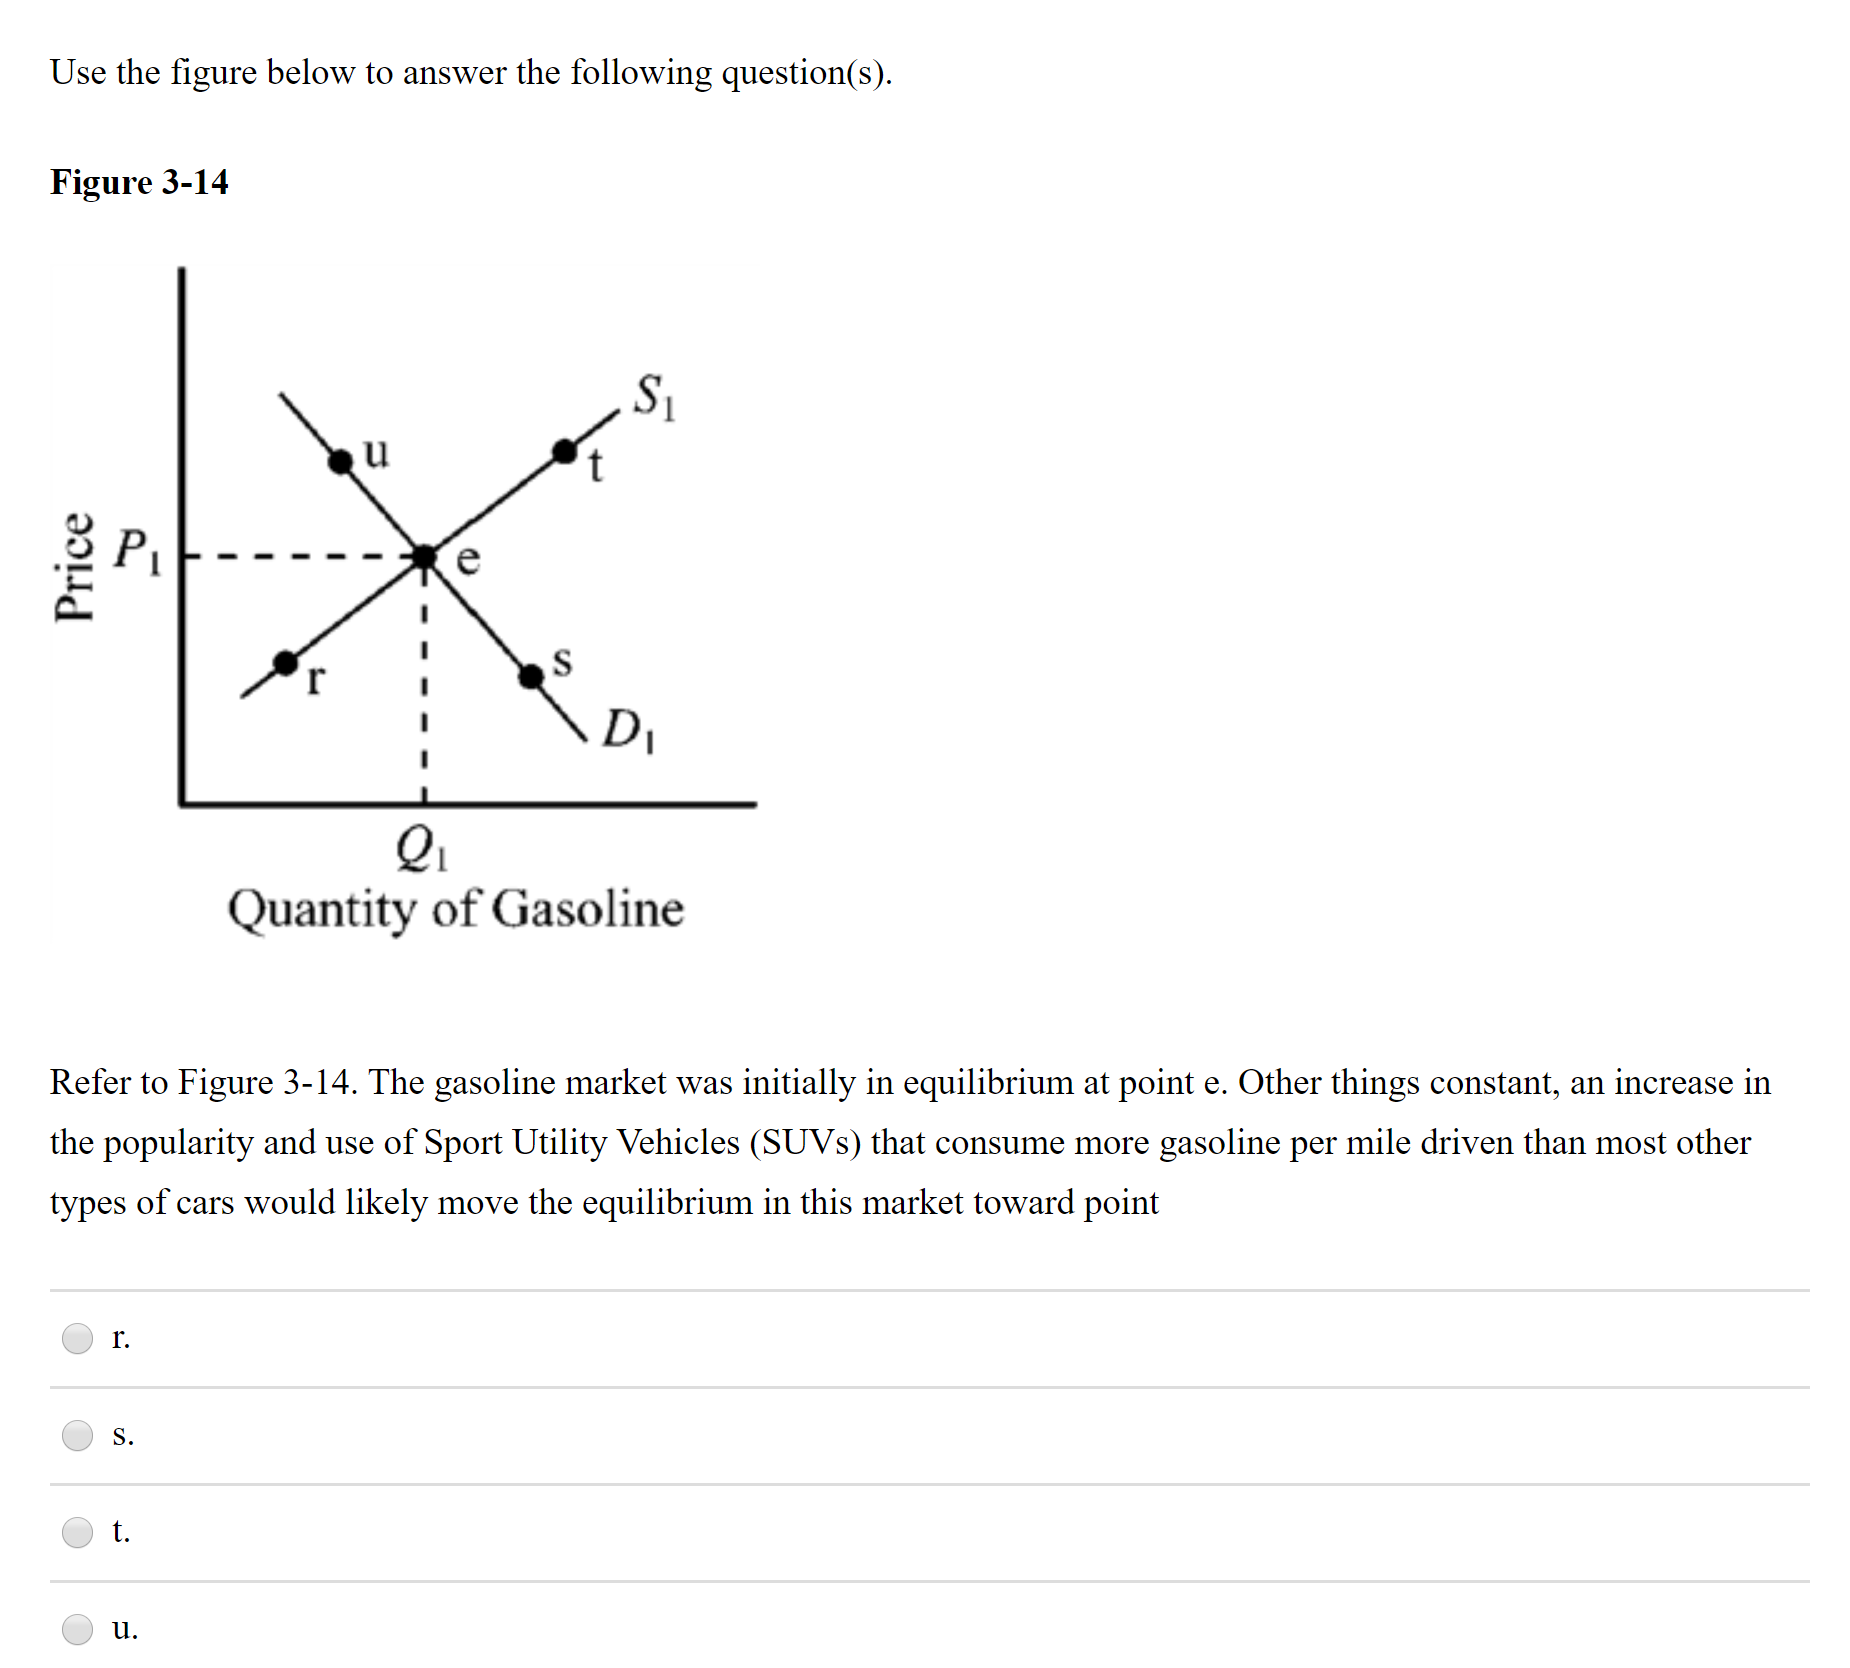
Refer to Figure 3-14. The gasoline market was initially in equilibrium at point e. Other things constant, an increase in the popularity and use of Sport Utility Vehicles (SUVS) that consume more gasoline per mile driven than most other types of cars would likely move the equilibrium in this market toward point r. S. t. u. Price
Q: al The dernand and supply schedules for wine are above. Plot both in a graph. Find the equilibrium…
A: a) As shown in diagram the downward sloping curve D is demand curve and upward sloping curve S is…
Q: The accompanying graph represents a demand curve for a bucket of golf balls at the local driving…
A: When the price decrease, then the quantity demanded increase. And there will be downward movement…
Q: Because bacon and egg are often eaten together, they are complements. a) We observe that both the…
A: When there is a change in price, the quantity demanded/quantity supplied changes. This causes a…
Q: price 10 4 1 10 20 30 40 so 60 70 80 quantity Refer to Figure 6-7. Suppose a price floor of $7 is…
A: The buyer’s expenditure before setting a price floor can be calculated as follows.
Q: Equilibrium is the condition in the market system when the quantity demanded is equal to the…
A:
Q: Lx Give Up? E Feedback Try Again Question 36 of 36 > O Attempt 1 The graph describes the market for…
A: Answer: If the cost of sugar (an important input of chocolate) increases then the cost of production…
Q: Suppose we are analyzing the market for hot chocolate. Graphically illustrate the impact each of…
A: g.) When the price of milk increases, then the price of input to making a hot chocolate also…
Q: Figure 3-7 Panel (a) Panel (b) Quantity Quantity Panel (c) Panel (d) D, D2 Quantity Quantity Refer…
A: As frozen yogurt and ice cream are substitute goods here, the increase in price of ice cream would…
Q: Newly imposed health-related regulations will require full-service (eat-in) restaurants to reduce…
A: The concept that tends to depict the number of goods that buyers are willing to buy and sellers are…
Q: 1. As the newest member of a team of economic advisors for the great state of Pennsylvania, you are…
A: The order-up-to-level inventory model is a fixed-time period model with a preset review interval.…
Q: The following diagram represents the market for hamburgers in Collegeville P2 P3 Q, Q, Q, Q…
A: Answer: option c (a decrease in the price of fries (a complement to hamburgers) coupled with a…
Q: With reference to the market for roses, and given the scenario explained in the excerpt, further…
A: Equilibrium is obtained where demand and supply curve intersect each other. Demand curve is a…
Q: Market researches have studied the market for milk,and their estimates for the supply of and the…
A: (a) The equilibrium demand and supply of milk in the economy can be obtained at the point of…
Q: Explain how the market demand curve for a normal good will shift (ie left, right or no shift in each…
A: Depending on whether the demand is individual or market, demand refers to the quantity of a…
Q: Because bagels and cream cheese are often eaten together, they are complements. a. We observe that…
A: There are two types of related goods; substitute goods and compliment goods. Substitute goods are…
Q: Suppose we are analyzing the market for hot chocolate. Graphically illustrate the impact the…
A: when the producer of hot chocolate expect the prices of hot chocolate to rise in future, they will…
Q: Q4) Draw a supply curve for the tables on the same diagram as the demand curve you have drawn for…
A: Answer: (4). Graphical presentation of the demand and supply curves: According to the above figure,…
Q: Because bagels and cream cheese are often eaten together,they are complements.a.We observe that both…
A: a) The complement goods are interrelated to each other by the cross elasticity of demand, which…
Q: Question 1' Suppose there are only two goods - Food (F) and Shelter (S). The demand equatic for…
A: Given The demand function for food and shelter DF=19-2.2pF-1.3pS .... (1)…
Q: Question 2 This diagram shows the market for cocoa. Equilibrium is currently at point x The market…
A: Speculation of future prices is one of the factors that can cause changes in the current demand for…
Q: Plot the demand curve from the demand schedule information provided Price Quantity 1 9 2 6 3 4 4 3…
A: Note: As per the guidelines we will answer only three subparts. Please resubmit the question again…
Q: Question 2 a) Briefly explain and show diagrammatically what will happen to the equilibrium price…
A: Hello. Since your question has multiple parts, we will solve first question for you. If you want…
Q: Consider the markets for film streaming services,TV screens,and tickets at movie theaters.a.For each…
A: A Complementary Good is defined as a good that is used in conjunction with another good. This kind…
Q: The demand and supply for a particular commodity are given by the following two equations: Demand: P…
A: Given, Demand Function- 12 - 0.2Qd Supply Function- 6+ 0.20Qs
Q: Once again, consider the market for avocados. Approximately 32 percent of the world's total…
A: Devastating wildfires destroy large swaths of California's avocado crop. This would result in…
Q: or each of the following events described, indicate the effects to the demand and to the supply. Use…
A: Gas-guzzling cars and gasoline are complement goods as both are demanded jointly to fulfil single…
Q: Consider the restaurant Jack in the Box. As a student, you visit Jack in the Box every week. After…
A: Inferior goods are the goods that have a lower price in the market and are demanded by the people in…
Q: Suppose the total demand for wheat and the total supply of wheat per month in the Kansas City grain…
A: Demand represents the volume of goods and services that the consumers are willing to buy at…
Q: 12. Market equilibrium The following table shows the monthly demand and supply in the market for…
A: Upward sloping curve= supply curve Downward sloping curve= Demand curve
Q: 1. In the passage below about price ceilings and floors, certain important words have been removed…
A: Price ceilings and price floors results in shortages and surpluses in the market. But the upward and…
Q: Draw a graph to represent the information given in the table below: Price Quantity Demanded (Qd)…
A: In a market, a demand curve is used to explain the behavior of the demand side participant that are…
Q: uppose that the citizens of a country are advised by the Health Authorities on the health benefits…
A: The equilibrium price is where the supply of the goods matches the demand. The force of supply and…
Q: Critically evaluate: “In comparing the two equilibrium positions in Figure, I note that a smaller…
A: Answer - Need to find - Critically evaluate: “In comparing the two equilibrium positions in Figure,…
Q: (ou will analyze the Market for Gasoline tep 1: Draw a supply-and-demand diagram. Price is on the…
A: Equilibrium in the market occurs where quantity demanded equals quantity supplied, that is at the…
Q: Explain how the market demand curve for a normal good will shift (ie left, right or no shift in each…
A: When the price of a substitute good falls then demand for a normal good decreases, it shifts…
Q: Suppose the demand for fish tacos is given by the following equation: Qd = 8-1P where Qd is the…
A: Here we calculate the price of fish Tacos by using the given information so the calculate of the…
Q: Nowadays, we can choose elth a laptop computer or a portabl electronic device. Recently, the…
A: It refers to those types of goods that can be used in place of one another. These goods have an…
Q: Suppose we are analyzing the market for hot chocolate. Graphically illustrate the impact the…
A: The producers expect the price of hot chocolate to increase next month. The short run effect of this…
Q: Suppose that the graph illustrates the market demand for video games per month with an equilibrium…
A: Demand refers to the desire backed by ability to buy and willingness to pay for a good and services…
Q: . Plot the supply curve from the supply schedule information provided. Price Quantity Supply (Qs) 1…
A: Hi Student, thanks for posting the question. As per the guideline, we are providing answer for the…
Q: Part f and i
A: (f)In this part, the U.S. surgeon announces that hot chocolate cure acnes; therefore, knowing this…
Q: Recent wildfires in northern California have destroyed much of the vineyards and grapes from which…
A: The demand for a quantity(Qd) depends upon the price of that quantity and also on other factors such…
Q: Refer to the information provided in Figure 3.18 below to answer the question(s) that follow. $ B. 4…
A: A demand curve may be a graph that shows the connection between worth|the worth|the value} of a…
Trending now
This is a popular solution!
Step by step
Solved in 3 steps with 1 images
- Suppose both of these events took place at the same time. Combine your analyses of the impacts of the iPod and the tariff Induction to determine the likely impact on the equilibrium price and quantity of Sony Walkman-type products. Shaw your answer graphically.What does a downward-sloping demand curve mean about how buyers in a market will react to a higher price?If a 10 decrease in the price of one product that you buy causes an 8 increase in quantity demanded of that product, will another 10 decrease in the price cause another 3 increase (no more and no less) in quantity demanded?
- The rules of politics are not always the same as the rules of economics. In discussions of setting budgets for government agencies, there is a strategy called closing the Washington Monument. When an agency faces the unwelcome prospect of a budget cut, it may decide to close a high-visibility attraction enjoyed by many people (like the Washington Monument). Explain in terms of diminishing marginal utility why the Washington Monument strategy is So misleading. Hint: If you are really trying to make the best of a budget cut, should you cut the items in your budget with tile highest marginal utility or line lowest marginal utility? Does the Washington Monument strategy cut the items with the highest marginal utility or line lowest marginal utility?A life-saving medicine without any close substitutes will tend to have a. a small elasticity of demand. b. a large elasticity of demand. c. a small elasticity of supply. d. a large elasticity of supply.A nomadic tribe in Lapland spends all its productive time hunting reindeer. Someof the reindeer meat is kept for consumption and the remainder is sold at a nearbytrading station in return for other goods. It is observed that when the price ofreindeer meat increases the amount the tribe is willing to supply decreases.(a) Sketch this situation in a diagram, with axes ‘reindeer meat’ and ‘all othergoods’. (Hint: locate the production position and sketch the consumptionopportunities line before and after the price change).(b) Determine if reindeer meat is an inferior good to the tribe?(Hint: consider what happens to the consumption position).(c) How does the analysis change if the tribe can hunt and trade fish as well as thereindeer? (Hint: now label the axes ‘reindeer meat’ and ‘fish’ and considerboth the production and consumption decisions
- The demand for pancakes is given by Qd = 40 – 5P and the supply is given byQs = 10P – 20, where P = price What is the equilibrium price and equilibriumquantity? i. The price for iPhones in Barbados has increased significantly. Demand for thecellular device has also increased. This is contrary to the law of demand. Doyou agree or disagree? Explain your answer. ii. Identify the flaw in this analysis: “If more Jamaicans become vegetarians, thedemand for beef will fall. The decrease in the demand for beef will cause theprice of beef to fall. The lower price, however, will then increase the demand.In the new equilibrium, Jamaicans might end up consuming more beef thanthey did initially.”answer please the last 2 sub questions The estimated demand for Canadian Processed Pork is given byQD = 171 − 20p + 20pB + 3pC + 2Ywhere QD is the quantity of pork demanded (millions of kg), p is the dollarprice per kg, pB is the price of beef per kg, pC is the price of chicken perkg, and Y is average consumer income in thousands of dollars. The supplyfor this market is given byQS = 178 + 40p − 60pB(a) According to the equations, what is the effect of an increase of pCon the market for pork? Specifically, which curve will shift, in whatdirection does the curve shift, and how will the equilibrium priceand quantity change (increase/decrease). On a corresponding graphof the supply and demand, draw the shifting curve and change inequilibrium. Note that no specific numbers are required here. Justthe direction of change.(b) Use the equations to solve for the equilibrium price of pork and quantity of pork as functions of the exogenous variables pB, pC , and Y .These will be linear…Time remaining:00 :09 :39EconomicsUse the following to answer questions (29) - (31):In the town of “One Horse” there is one movie theater. Two groups of consumers, adults (A) andchildren (C), attend this theater. Suppose the demand for movies by adults is given by:QA = 50 - 0.50PA, where PAis price ofan adultmovie ticket(in cents)and QAis the numberofmovie tickets sold to adults atthe theater. Suppose the demand for movies by children is given by:QC = 20 - 0.50PC,where PCispriceofa children’s movie ticket(in cents)and QCis the numberofmovie tickets sold tochildren atthe theater. Also, imagine totalcostis fixed at$450, thus makingmarginalcostofprovidingonemore movie ticket to either an adult or a child constant at zero.[29]Ifthe movie theateris able to price discriminate amongits two groups ofconsumers, then itshouldcharge a higher price to group A.A.TrueB.False[30]Ifthemovie theateris able to price discriminate amongits two groups ofconsumers, then itsmaximum profit is closest in value…
- Table 3.9 illustrates the market's demand andsupply for cheddar cheese. Graph the data and find theequilibrium. Next, create a table showing the change inquantity demanded or quantity supplied, and a graph ofthe new equilibrium, in each of the following situations:a. The price of milk, a key input for cheeseproduction, rises, so that the supply decreases by80 pounds at every price.b. A new study says that eating cheese is good foryour health, so that demand increases by 20% atevery price.. It is a hot day, and Bert is thirsty. Here is the value heplaces on each bottle of water:Value of first bottle $7Value of second bottle $5Value of third bottle $3Value of fourth bottle $1a. From this information, derive Bert’s demandschedule. Graph his demand curve for bottledwater.b. If the price of a bottle of water is $4, how manybottles does Bert buy? How much consumersurplus does Bert get from his purchases? ShowBert’s consumer surplus in your graph.c. If the price falls to $2, how does quantitydemanded change? How does Bert’s consumersurplus change? Show these changes in yourgraph.From the following demand and supply equation find the equilibrium price (ePx); Qdx= 38.1Px-387.6 and Qsx= 17.4Px+129.8 Select one: a. -0.08 b. 538.10 c. 25.00 d. 9.32