Use the figure to the right, which shows the percentages of adults from severa power plants in their country. The survey included random samples of 1034 adults from Country A, 1053 adults from Country B, 1118 adults from Country C, and 1030 adults from Country D. At a = 0.05, can you reject the claim that the proportion of adults in Country A who favor building new nuclear power plants in their country is the same as the proportion of adults from Country B who favor building new nuclear power plants in their country? ASsume the random samples are independent. 80- 60- 40- 20- 0- | Country A 48% Country B 52% O Country C 43% O Country D 36% dentify the claim and state Ho and Ha the proportion of adults from Country B The claim is "the proportion of adults in Country A who favor building new nuclear power plants in their country is who favor building new nuclear power plants in their country." Let p, represent the population proportion for Country A and p2 represent the population proportion for Country B. State Ho and Ha. Choose the correct answer below. O C. Ho: P1 S P2 Ha: P1 > P2 O A. Ho: P1 = P2 O B. Ho: P1 < P2 Ha: P1 P2 Ha: P1 2 P2 O D. Ho: P1 > P2 O E. Ho: P1 # P2 O F. Ho: P12 Ha: P1 = P2 Ha: P1
Use the figure to the right, which shows the percentages of adults from severa power plants in their country. The survey included random samples of 1034 adults from Country A, 1053 adults from Country B, 1118 adults from Country C, and 1030 adults from Country D. At a = 0.05, can you reject the claim that the proportion of adults in Country A who favor building new nuclear power plants in their country is the same as the proportion of adults from Country B who favor building new nuclear power plants in their country? ASsume the random samples are independent. 80- 60- 40- 20- 0- | Country A 48% Country B 52% O Country C 43% O Country D 36% dentify the claim and state Ho and Ha the proportion of adults from Country B The claim is "the proportion of adults in Country A who favor building new nuclear power plants in their country is who favor building new nuclear power plants in their country." Let p, represent the population proportion for Country A and p2 represent the population proportion for Country B. State Ho and Ha. Choose the correct answer below. O C. Ho: P1 S P2 Ha: P1 > P2 O A. Ho: P1 = P2 O B. Ho: P1 < P2 Ha: P1 P2 Ha: P1 2 P2 O D. Ho: P1 > P2 O E. Ho: P1 # P2 O F. Ho: P12 Ha: P1 = P2 Ha: P1

Holt Mcdougal Larson Pre-algebra: Student Edition 2012
1st Edition
ISBN:9780547587776
Author:HOLT MCDOUGAL
Publisher:HOLT MCDOUGAL
Chapter11: Data Analysis And Probability
Section: Chapter Questions
Problem 8CR

Related questions

Concept explainers
Equations and Inequations
Equations and inequalities describe the relationship between two mathematical expressions.
Linear Functions
A linear function can just be a constant, or it can be the constant multiplied with the variable like x or y. If the variables are of the form, x2, x1/2 or y2 it is not linear. The exponent over the variables should always be 1.
Question
22 solve all parts please
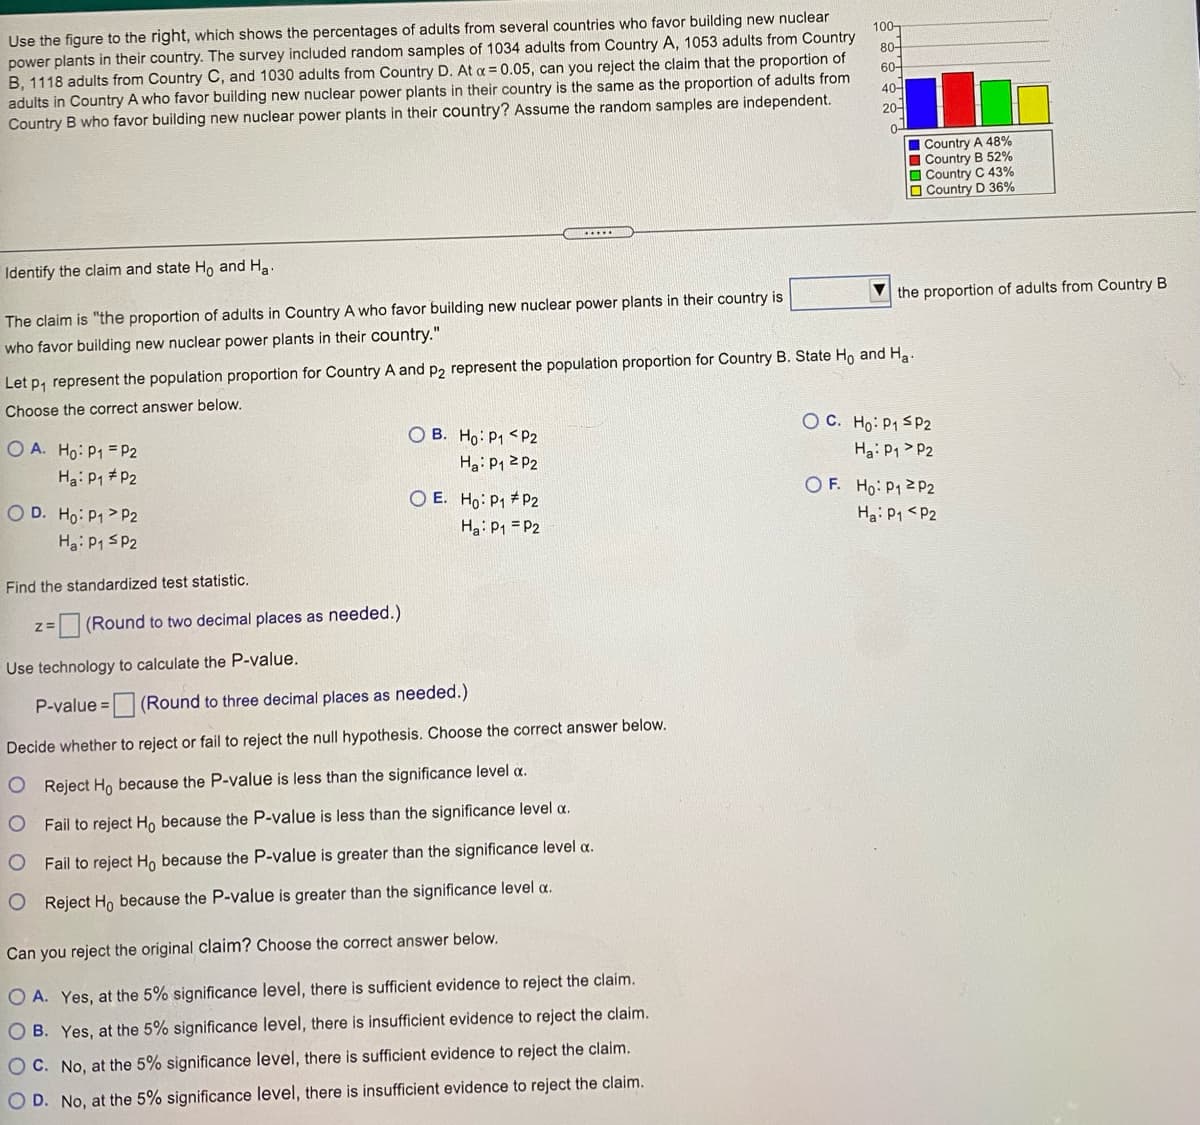
Transcribed Image Text:Use the figure to the right, which shows the percentages of adults from several countries who favor building new nuclear
power plants in their country. The survey included random samples of 1034 adults from Country A, 1053 adults from Country
B, 1118 adults from Country C, and 1030 adults from Country D. At a = 0.05, can you reject the claim that the proportion of
adults in Country A who favor building new nuclear power plants in their country is the same as the proportion of adults from
Country B who favor building new nuclear power plants in their country? Assume the random samples are independent.
100-
80-
60-
40-
20-
0-
| Country A 48%
Country B 52%
O Country C 43%
O Country D 36%
Identify the claim and state Ho and Ha
V the proportion of adults from Country B
The claim is "the proportion of adults in Country A who favor building new nuclear power plants in their country is
who favor building new nuclear power plants in their country."
Let p, represent the population proportion for Country A and p2 represent the population proportion for Country B. State Ho and Ha-
Choose the correct answer below.
OC. Ho: P1 SP2
Ha: P1 > P2
O B. Ho: P1 <P2
O A. Ho: P1 = P2
Ha: P1 P2
Ha: P1 2 P2
OF. Ho: P12P2
O E. Ho: P1 # P2
Ha: P1 = P2
O D. Ho: P1> P2
Ha: P1 <P2
Ha: P1 SP2
Find the standardized test statistic.
z=
(Round to two decimal places as needed.)
Use technology to calculate the P-value.
P-value = (Round to three decimal places as needed.)
e 3D
Decide whether to reject or fail to reject the null hypothesis. Choose the correct answer below.
O Reject Ho because the P-value is less than the significance level a.
Fail to reject Ho because the P-value is less than the significance level a.
O Fail to reject H, because the P-value is greater than the significance level a.
O Reject Ho because the P-value is greater than the significance level a.
Can you reject the original claim? Choose the correct answer below.
O A. Yes, at the 5% significance level, there is sufficient evidence to reject the claim.
O B. Yes, at the 5% significance level, there is insufficient evidence to reject the claim.
O C. No, at the 5% significance level, there is sufficient evidence to reject the claim.
O D. No, at the 5% significance level, there is insufficient evidence to reject the claim.
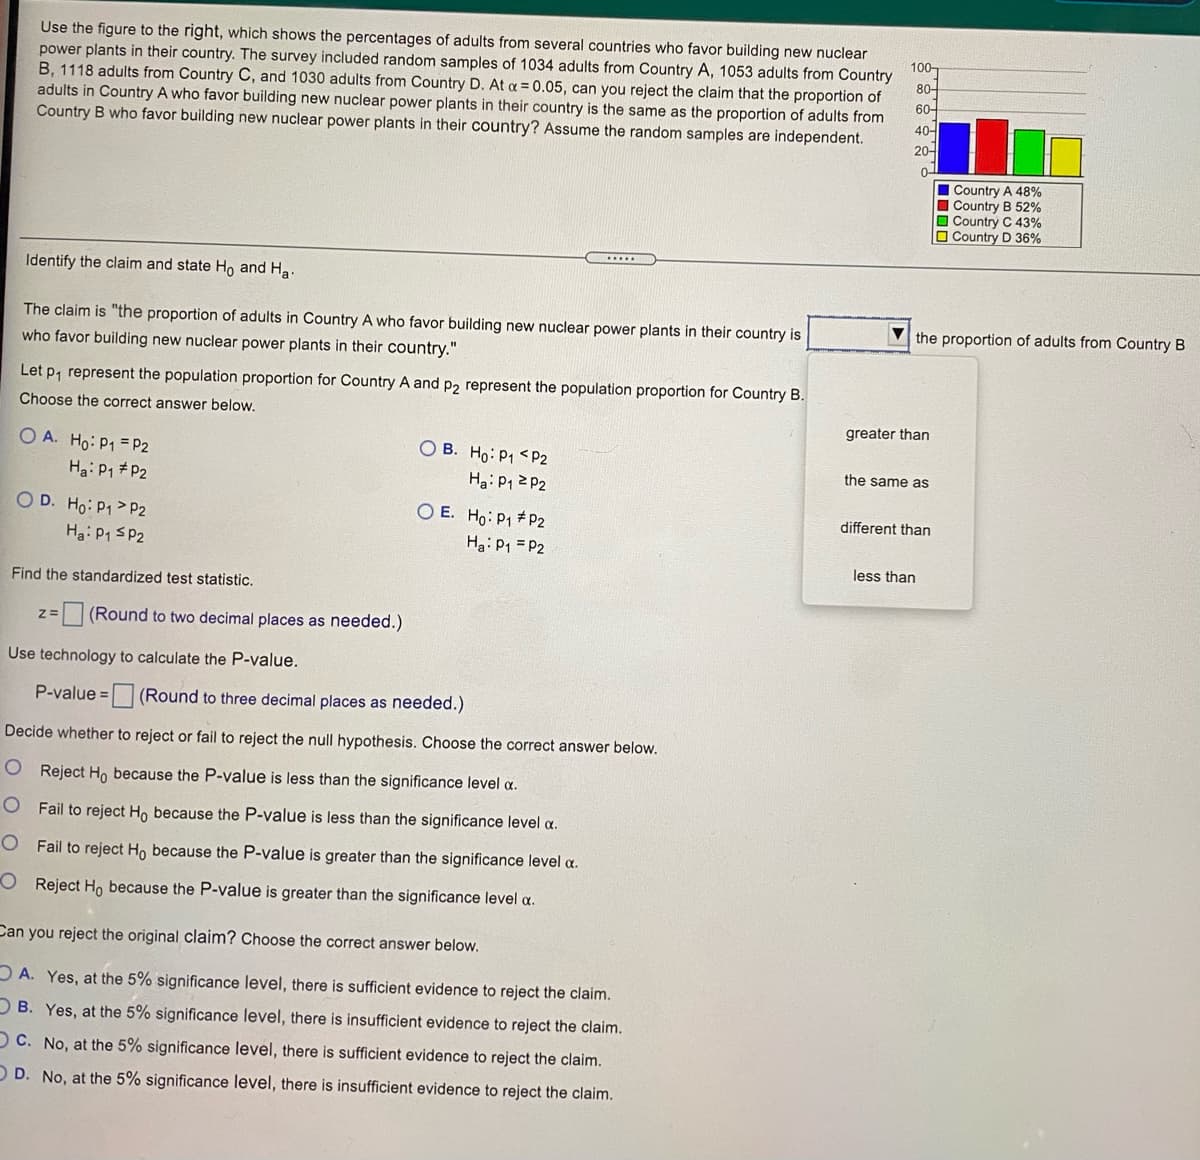
Transcribed Image Text:Use the figure to the right, which shows the percentages of adults from several countries who favor building new nuclear
power plants in their country. The survey included random samples of 1034 adults from Country A, 1053 adults from Country
B, 1118 adults from Country C, and 1030 adults from Country D. At a = 0.05, can you reject the claim that the proportion of
adults in Country A who favor building new nuclear power plants in their country is the same as the proportion of adults from
Country B who favor building new nuclear power plants in their country? Assume the random samples are independent.
100-
80-
60-
40-
20-
Country A 48%
Country B 52%
O Country C 43%
O Country D 36%
....
Identify the claim and state Ho and Ha.
The claim is "the proportion of adults in Country A who favor building new nuclear power plants in their country is
the proportion of adults from Country B
who favor building new nuclear power plants in their country."
Let p, represent the population proportion for Country A and p2 represent the population proportion for Country B.
Choose the correct answer below.
greater than
O A. Ho: P1 = P2
Ha: P1 P2
O B. Ho: P1 <P2
Ha: P1 2 P2
the same as
O D. Ho: P1 > P2
Hg: P1 SP2
O E. Ho: P1 #P2
Ha: P1 = P2
different than
less than
Find the standardized test statistic.
(Round to two decimal places as needed.)
z=
Use technology to calculate the P-value.
P-value = (Round to three decimal places as needed.)
Decide whether to reject or fail to reject the null hypothesis. Choose the correct answer below.
O Reject Ho because the P-value is less than the significance level a.
O Fail to reject Ho because the P-value is less than the significance level a.
O Fail to reject Ho because the P-value is greater than the significance level a.
O Reject Ho because the P-value is greater than the significance level a.
Can you reject the original claim? Choose the correct answer below.
DA. Yes, at the 5% significance level, there is sufficient evidence to reject the claim.
D B. Yes, at the 5% significance level, there is insufficient evidence to reject the claim.
OC. No, at the 5% significance level, there is sufficient evidence to reject the claim.
O D. No, at the 5% significance level, there is insufficient evidence to reject the claim.
Expert Solution
This question has been solved!
Explore an expertly crafted, step-by-step solution for a thorough understanding of key concepts.

Step by step
Solved in 2 steps with 2 images

Knowledge Booster


Learn more about
Need a deep-dive on the concept behind this application? Look no further. Learn more about this topic, statistics and related others by exploring similar questions and additional content below.Recommended textbooks for you
Holt Mcdougal Larson Pre-algebra: Student Edition…
Algebra
ISBN:
9780547587776
Author:
HOLT MCDOUGAL
Publisher:
HOLT MCDOUGAL

Glencoe Algebra 1, Student Edition, 9780079039897…
Algebra
ISBN:
9780079039897
Author:
Carter
Publisher:
McGraw Hill
Holt Mcdougal Larson Pre-algebra: Student Edition…
Algebra
ISBN:
9780547587776
Author:
HOLT MCDOUGAL
Publisher:
HOLT MCDOUGAL
Glencoe Algebra 1, Student Edition, 9780079039897…
Algebra
ISBN:
9780079039897
Author:
Carter
Publisher:
McGraw Hill