Use the figure to the right, which shows the percentages of adults from several countries who favor building new nuclear power plants in their country. The survey included random samples of 1128 adults from Country A, 1026 adults from Country B, 1008 adults from Country C, and 1061 adults from Country D. At a = 0.01, can you reject the ciaim that the 100- proportion of adults in Country C who favor building new nuclear power plants in their country is greater than the proportion of adults from Country D who favor building new nudear 80 60 40- 20 power plants in their country? Assume the random samples are independent. I Country A 50% I Country B 46% O Country C 45% O Country D 39% Choose the correct answer below. OA Ho: P1 2P2 H P, P2 H P, SP2 OF Ho: P =Pz H P, P2 VE Ho: P, SPz H P, > P2 Find the standardized test statistic. z= 2.76 (Round to two decimal places as needed.) Use technology to calculate the P-value. P-value = 0.0028 (Round to four decimal places as needed.) Decide whether reject or fail to reject the null hypothesis. Choose the correct answer below. O Fail to reject H, because the P-value is greater than the significance level a. Fail to reject Ho because the P-value is less than the significance level a O Reject H, because the P-value is less than the significance level a. O Reject H, because the P-value is greater than the significance level a
Use the figure to the right, which shows the percentages of adults from several countries who favor building new nuclear power plants in their country. The survey included random samples of 1128 adults from Country A, 1026 adults from Country B, 1008 adults from Country C, and 1061 adults from Country D. At a = 0.01, can you reject the ciaim that the 100- proportion of adults in Country C who favor building new nuclear power plants in their country is greater than the proportion of adults from Country D who favor building new nudear 80 60 40- 20 power plants in their country? Assume the random samples are independent. I Country A 50% I Country B 46% O Country C 45% O Country D 39% Choose the correct answer below. OA Ho: P1 2P2 H P, P2 H P, SP2 OF Ho: P =Pz H P, P2 VE Ho: P, SPz H P, > P2 Find the standardized test statistic. z= 2.76 (Round to two decimal places as needed.) Use technology to calculate the P-value. P-value = 0.0028 (Round to four decimal places as needed.) Decide whether reject or fail to reject the null hypothesis. Choose the correct answer below. O Fail to reject H, because the P-value is greater than the significance level a. Fail to reject Ho because the P-value is less than the significance level a O Reject H, because the P-value is less than the significance level a. O Reject H, because the P-value is greater than the significance level a

Glencoe Algebra 1, Student Edition, 9780079039897, 0079039898, 2018
18th Edition
ISBN:9780079039897
Author:Carter
Publisher:Carter
Chapter10: Statistics
Section10.6: Summarizing Categorical Data
Problem 26PPS

Related questions
Question
Decide whether to reject or fail to reject the null hypothesis. Choose the correct answer below.
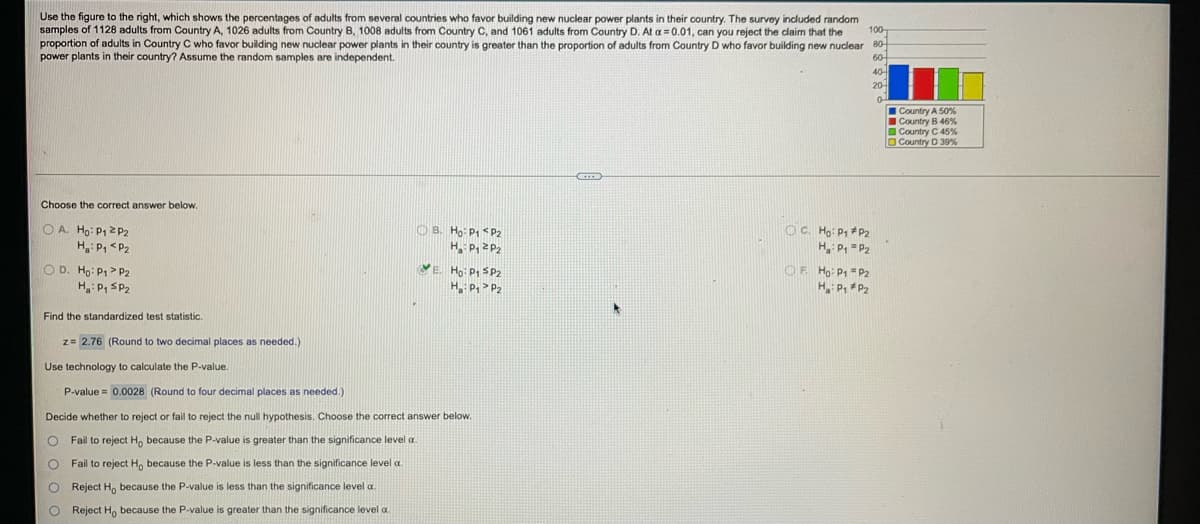
Transcribed Image Text:Use the figure to the right, which shows the percentages of adults from several countries who favor building new nuclear power plants i
samples of 1128 adults from Country A, 1026 adults from Country B, 1008 adults from Country C, and 1061 adults from Country D. At a = 0.01, can you reject the claim that the
proportion of adults in Country C who favor building new nuclear power plants in their country is greater than the proportion of adults from Country D who favor building new nudear 80-
power plants in their country? Assume the random samples are independent.
their country. The survey included random
100-
60
40-
20-
Country A 50%
ICountry B 46%
O Country C 45%
O Country D 39%
Choose the correct answer below.
O A. Ho: P, 2p2
H: P, <P2
O B. Ho: P1 <P2
H P, 2P2
OC. Họ: P1 P2
H: P, =P2
VE. Ho: P1 SP2
H P, > P
O D. Ho: P1> P2
OF Ho: P = P2
H P, P2
H: P, SP2
Find the standardized test statistic.
z= 2.76 (Round to two decimal places as needed.)
Use technology to calculate the P-value
P-value = 0.0028 (Round to four decimal places as needed.)
Decide whether to reject or fail to reject the null hypothesis. Choose the correct answer below.
O Fail to reject H, because the P-value is greater than the significance level a.
Fail to reject H, because the P-value is less t
the significance level a
O Reject H, because the P-value is less than the significance level a.
O Reject Ho because the P-value is greater than the significance level a
Expert Solution
This question has been solved!
Explore an expertly crafted, step-by-step solution for a thorough understanding of key concepts.

Step by step
Solved in 2 steps

Recommended textbooks for you
Glencoe Algebra 1, Student Edition, 9780079039897…
Algebra
ISBN:
9780079039897
Author:
Carter
Publisher:
McGraw Hill

Algebra: Structure And Method, Book 1
Algebra
ISBN:
9780395977224
Author:
Richard G. Brown, Mary P. Dolciani, Robert H. Sorgenfrey, William L. Cole
Publisher:
McDougal Littell

Glencoe Algebra 1, Student Edition, 9780079039897…
Algebra
ISBN:
9780079039897
Author:
Carter
Publisher:
McGraw Hill
Algebra: Structure And Method, Book 1
Algebra
ISBN:
9780395977224
Author:
Richard G. Brown, Mary P. Dolciani, Robert H. Sorgenfrey, William L. Cole
Publisher:
McDougal Littell