If a constant c is added to each xi in a sample, yielding y; = x; + c, how do the sample mean and median of the y;s relate to the mean and median of the x;s? Verify your conjectures. а. b. If each x; is multiplied by a constant c, yielding y; = cx¡, answer the question of part (a). Again, verify your conjectures.
If a constant c is added to each xi in a sample, yielding y; = x; + c, how do the sample mean and median of the y;s relate to the mean and median of the x;s? Verify your conjectures. а. b. If each x; is multiplied by a constant c, yielding y; = cx¡, answer the question of part (a). Again, verify your conjectures.

Holt Mcdougal Larson Pre-algebra: Student Edition 2012
1st Edition
ISBN:9780547587776
Author:HOLT MCDOUGAL
Publisher:HOLT MCDOUGAL
Chapter11: Data Analysis And Probability
Section: Chapter Questions
Problem 2CST

Related questions
Question
The images attached has my questions.
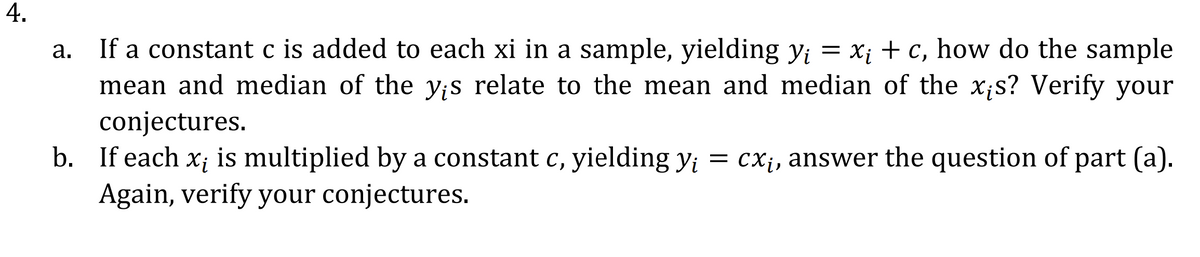
Transcribed Image Text:If a constant c is added to each xi in a sample, yielding Yi = x; + c, how do the sample
mean and median of the y;s relate to the mean and median of the x;s? Verify your
conjectures.
а.
is multiplied by a constant c, yielding y; = cX¡, answer the question of part (a).
Xi
b. If each
Again, verify your conjectures.
4.
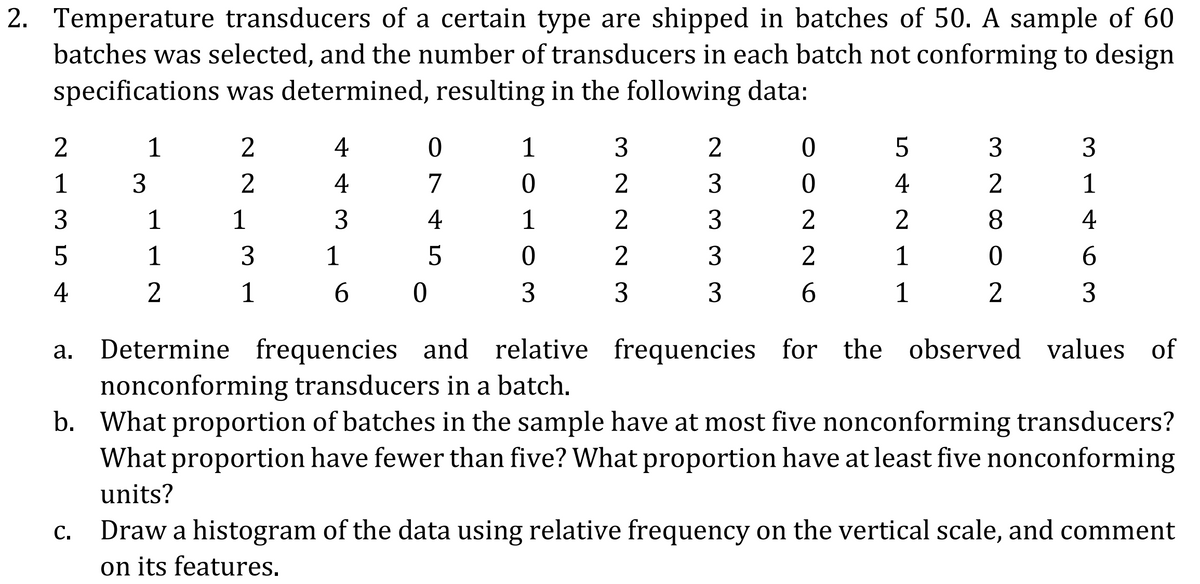
Transcribed Image Text:2. Temperature transducers of a certain type are shipped in batches of 50. A sample of 60
batches was selected, and the number of transducers in each batch not conforming to design
specifications was determined, resulting in the following data:
1
2
4
1
3
2
5
3
3
1
3
2
4
7
2
3
4
2
1
3
1
1
3
4
1
2
3
2
8
4
1
3
1
5
3
1
6.
4
2
1
6.
3
3
3
1
2
3
Determine frequencies and relative frequencies for the observed values of
nonconforming transducers in a batch.
b. What proportion of batches in the sample have at most five nonconforming transducers?
What proportion have fewer than five? What proportion have at least five nonconforming
а.
units?
Draw a histogram of the data using relative frequency on the vertical scale, and comment
on its features.
С.
OON N 6
Expert Solution
This question has been solved!
Explore an expertly crafted, step-by-step solution for a thorough understanding of key concepts.

This is a popular solution!

Trending now
This is a popular solution!

Step by step
Solved in 3 steps

Recommended textbooks for you
Holt Mcdougal Larson Pre-algebra: Student Edition…
Algebra
ISBN:
9780547587776
Author:
HOLT MCDOUGAL
Publisher:
HOLT MCDOUGAL

Glencoe Algebra 1, Student Edition, 9780079039897…
Algebra
ISBN:
9780079039897
Author:
Carter
Publisher:
McGraw Hill
Holt Mcdougal Larson Pre-algebra: Student Edition…
Algebra
ISBN:
9780547587776
Author:
HOLT MCDOUGAL
Publisher:
HOLT MCDOUGAL
Glencoe Algebra 1, Student Edition, 9780079039897…
Algebra
ISBN:
9780079039897
Author:
Carter
Publisher:
McGraw Hill