Use the file on Blackboard called “Excel Databases.xlsx". Locate the Manufacturer tab. Test to determine if there is a significant difference between Mean Value Added by the manufacturer and the mean Cost of Materials in manufacturing assuming a 1% level of significance. Use Excel to perform the appropriate two-sample t-test as indicated by your conclusion from the F-test. What is the value of the test statistic output by Excel when running the two-sample t-test? O a. 2.34 O b.0.39 Oc. 0.51 O d. 0.66 QUESTION 4 Use the file on Blackboard called "Excel Databases.xlsx". Locate the Manufacturer tab. Test to determine if there is a significant difference between Mean Value Added by the manufacturer and the mean Cost of Materials in manufacturing assuming a 1% level of significance. Using the results of the two-sample t-test performed on Excel, at a 1% level of significance, what conclusion can you draw for this research study? Why? O a. There is not a significant difference between the mean value added and the mean cost of materials in manufacturing with a p-value of 0.51. O b. There is a significant difference between the mean value added and the mean cost of materials in manufacturing with a p-value of 0.26. O. There is a significant difference between the mean value added and the mean cost of materials in manufacturing with a p-value of 0.51. O d. There is not a significant difference between the mean value added and the mean cost of materials in manufacturing with a p-value of 0.26.
Use the file on Blackboard called “Excel Databases.xlsx". Locate the Manufacturer tab. Test to determine if there is a significant difference between Mean Value Added by the manufacturer and the mean Cost of Materials in manufacturing assuming a 1% level of significance. Use Excel to perform the appropriate two-sample t-test as indicated by your conclusion from the F-test. What is the value of the test statistic output by Excel when running the two-sample t-test? O a. 2.34 O b.0.39 Oc. 0.51 O d. 0.66 QUESTION 4 Use the file on Blackboard called "Excel Databases.xlsx". Locate the Manufacturer tab. Test to determine if there is a significant difference between Mean Value Added by the manufacturer and the mean Cost of Materials in manufacturing assuming a 1% level of significance. Using the results of the two-sample t-test performed on Excel, at a 1% level of significance, what conclusion can you draw for this research study? Why? O a. There is not a significant difference between the mean value added and the mean cost of materials in manufacturing with a p-value of 0.51. O b. There is a significant difference between the mean value added and the mean cost of materials in manufacturing with a p-value of 0.26. O. There is a significant difference between the mean value added and the mean cost of materials in manufacturing with a p-value of 0.51. O d. There is not a significant difference between the mean value added and the mean cost of materials in manufacturing with a p-value of 0.26.

Glencoe Algebra 1, Student Edition, 9780079039897, 0079039898, 2018
18th Edition
ISBN:9780079039897
Author:Carter
Publisher:Carter
Chapter10: Statistics
Section: Chapter Questions
Problem 25SGR

Related questions

Concept explainers
Equations and Inequations
Equations and inequalities describe the relationship between two mathematical expressions.
Linear Functions
A linear function can just be a constant, or it can be the constant multiplied with the variable like x or y. If the variables are of the form, x2, x1/2 or y2 it is not linear. The exponent over the variables should always be 1.
Question
| Value Added by Mfg. | Cost of Materials |
| 23518 | 78713 |
| 15724 | 42774 |
| 24506 | 27222 |
| 21667 | 37040 |
| 20712 | 12030 |
| 12640 | 13674 |
| 4258 | 19130 |
| 35210 | 33521 |
| 20548 | 19612 |
| 23442 | 5557 |
| 287 | 163 |
| 1508 | 314 |
| 624 | 2622 |
| 2471 | 4219 |
| 4307 | 5357 |
| 673 | 1061 |
| 817 | 707 |
| 8986 | 10421 |
| 3145 | 4140 |
| 4076 | 7125 |
| 3806 | 8994 |
| 4276 | 5504 |
| 1239 | 716 |
| 9423 | 8926 |
| 11045 | 11121 |
| 1916 | 2283 |
| 599 | 364 |
| 2063 | 1813 |
| 34 | 71 |
| 1445 | 1321 |
| 10603 | 12376 |
| 5775 | 9661 |
| 10404 | 19285 |
| 13274 | 18632 |
| 1909 | 2170 |
| 4606 | 7290 |
| 5518 | 8135 |
| 12464 | 12980 |
| 5447 | 4011 |
| 2290 | 5101 |
| 4182 | 3755 |
| 2818 | 2694 |
| 2201 | 3279 |
| 18848 | 20596 |
| 9655 | 10604 |
| 15668 | 24634 |
| 25918 | 28963 |
| 30692 | 8483 |
| 17982 | 6940 |
| 17857 | 8863 |
| 9699 | 2823 |
| 38407 | 29572 |
| 3878 | 3811 |
| 3989 | 1047 |
| 4388 | 2055 |
| 4055 | 1098 |
| 16567 | 11298 |
| 25025 | 34596 |
| 59813 | 27187 |
| 31801 | 19932 |
| 8497 | 9849 |
| 28886 | 46935 |
| 12277 | 11130 |
| 11547 | 13085 |
| 26006 | 132880 |
| 3464 | 6182 |
| 2187 | 4446 |
| 7079 | 7091 |
| 442 | 496 |
| 4528 | 3805 |
| 7275 | 7195 |
| 55621 | 57264 |
| 1313 | 1865 |
| 162 | 163 |
| 1907 | 1682 |
| 53 | 85 |
| 747 | 395 |
| 328 | 255 |
| 233 | 177 |
| 1717 | 943 |
| 6532 | 3527 |
| 4850 | 4254 |
| 3509 | 2282 |
| 2176 | 1387 |
| 2696 | 1183 |
| 15739 | 17010 |
| 999 | 565 |
| 7838 | 5432 |
| 29180 | 45696 |
| 9061 | 6913 |
| 4200 | 11184 |
| 1410 | 5735 |
| 16670 | 31892 |
| 5856 | 4696 |
| 3164 | 2790 |
| 3999 | 9364 |
| 11750 | 8720 |
| 4412 | 3527 |
| 27974 | 31527 |
| 6936 | 4909 |
| 19880 | 21531 |
| 7793 | 6232 |
| 3528 | 1689 |
| 21718 | 19273 |
| 10513 | 12954 |
| 9545 | 11858 |
| 18178 | 23474 |
| 22673 | 14343 |
| 19221 | 16515 |
| 23110 | 18543 |
| 41135 | 60857 |
| 17521 | 21819 |
| 25322 | 13897 |
| 6700 | 5523 |
| 14278 | 12657 |
| 9466 | 12578 |
| 13428 | 11065 |
| 3459 | 7621 |
| 38705 | 29591 |
| 84059 | 44486 |
| 13920 | 13398 |
| 105899 | 223639 |
| 45220 | 42367 |
| 7903 | 7760 |
| 2590 | 4363 |
| 1435 | 1674 |
| 9986 | 8120 |
| 3564 | 5476 |
| 21071 | 8760 |
| 29028 | 18028 |
| 31051 | 16787 |
| 2390 | 1020 |
| 14032 | 8114 |
| 415 | 382 |
| 2761 | 3646 |
| 685 | 506 |
| 8327 | 6604 |
| 2643 | 1789 |
| 1406 | 997 |
| 11199 | 8530 |
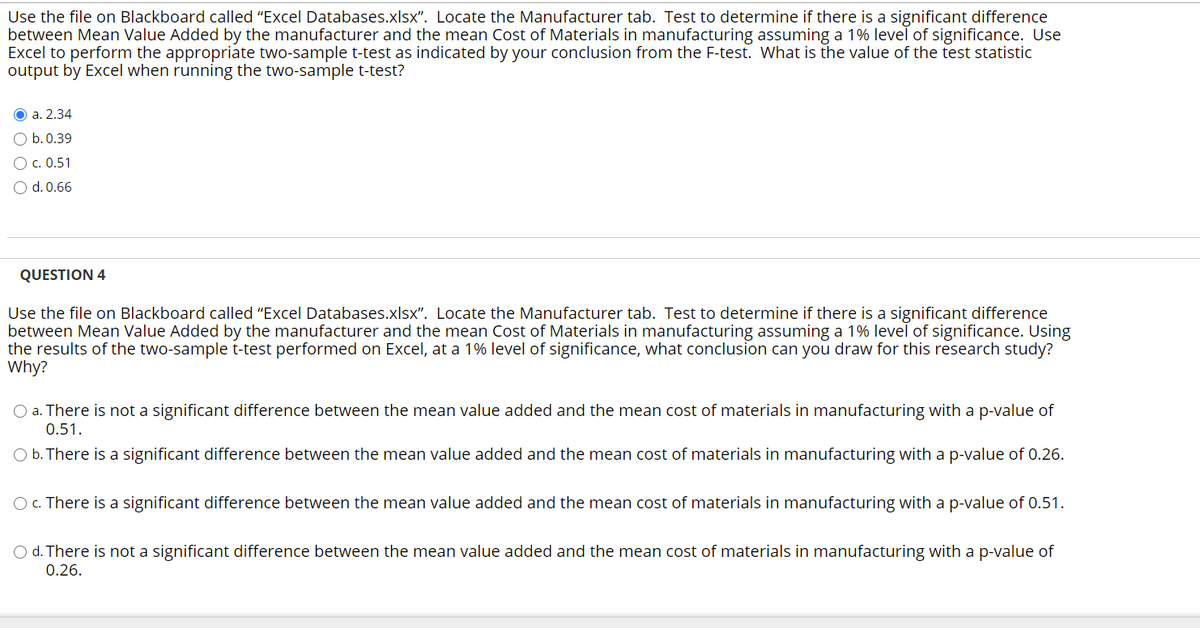
Transcribed Image Text:Use the file on Blackboard called "Excel Databases.xlsx". Locate the Manufacturer tab. Test to determine if there is a significant difference
between Mean Value Added by the manufacturer and the mean Cost of Materials in manufacturing assuming a 1% level of significance. Use
Excel to perform the appropriate two-sample t-test as indicated by your conclusion from the F-test. What is the value of the test statistic
output by Excel when running the two-sample t-test?
O a. 2.34
O b.0.39
О с. 0.51
d. 0.66
QUESTION 4
Use the file on Blackboard called "Excel Databases.xlsx". Locate the Manufacturer tab. Test to determine if there is a significant difference
between Mean Value Added by the manufacturer and the mean Cost of Materials in manufacturing assuming a 1% level of significance. Using
the results of the two-sample t-test performed on Excel, at a 1% level of significance, what conclusion can you draw for this research study?
Why?
O a. There is not a significant difference between the mean value added and the mean cost of materials in manufacturing with a p-value of
0.51.
O b. There is a significant difference between the mean value added and the mean cost of materials in manufacturing with a p-value of 0.26.
O c. There is a significant difference between the mean value added and the mean cost of materials in manufacturing with a p-value of 0.51.
O d. There is not a significant difference between the mean value added and the mean cost of materials in manufacturing with a p-value of
0.26.
Expert Solution
This question has been solved!
Explore an expertly crafted, step-by-step solution for a thorough understanding of key concepts.

This is a popular solution!

Trending now
This is a popular solution!

Step by step
Solved in 2 steps with 6 images

Knowledge Booster


Learn more about
Need a deep-dive on the concept behind this application? Look no further. Learn more about this topic, statistics and related others by exploring similar questions and additional content below.Recommended textbooks for you
Glencoe Algebra 1, Student Edition, 9780079039897…
Algebra
ISBN:
9780079039897
Author:
Carter
Publisher:
McGraw Hill
Glencoe Algebra 1, Student Edition, 9780079039897…
Algebra
ISBN:
9780079039897
Author:
Carter
Publisher:
McGraw Hill