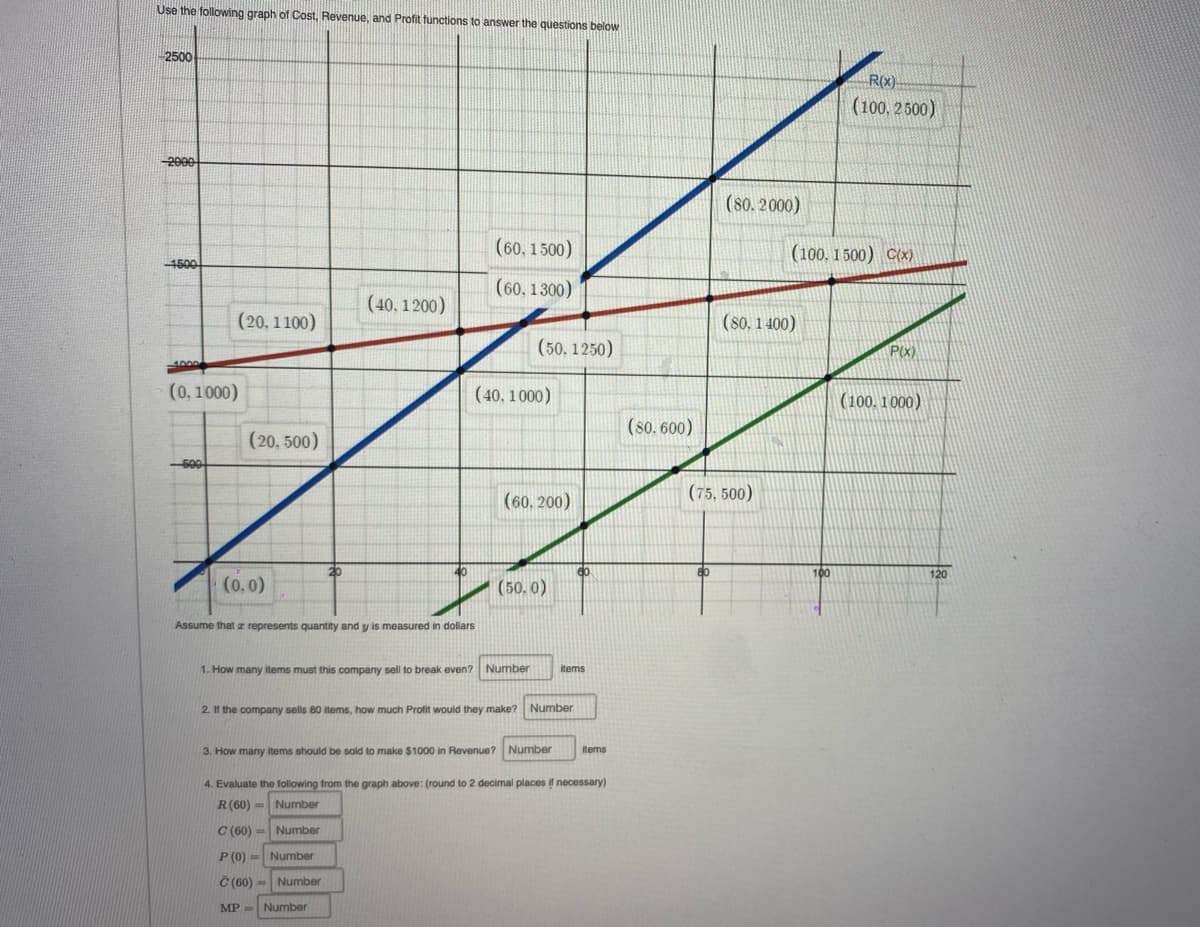
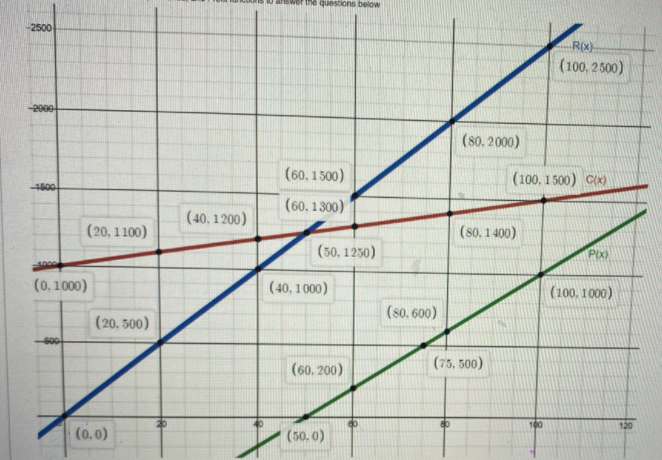
Use the following graph of Cost, Revenue, and Profit functions to answer the questions below 2500 R(x) (100, 2 500) -2000 (80. 2000) (60, 1500) (100, 1 500) C(x) 1500 (60, 1300) (40, 1 200) (20, 1100) (80. 1 400) (50. 1250) Px) 4000 (0,1000) (40, 1000) (100. 1000) (80. 600) (20, 500) -500 (60, 200) (75, 500) 20 60 80 100 120 (0.0) (50. 0) Assume that z represents quantity and y is measured in dollars 1. How many items must this company sell to break even? Number items 2. the company sells 80 items, how much Profit would they make? Number 3. How many items should be sold to make $1000 in Revenue? Number tems 4. Evaluate the following from the graph above: (round to 2 decimal places necessary) R(60) - Number C (60) - Number P (0) - Number Č (60) - Number MP-Number
Use the following graph of Cost, Revenue, and Profit functions to answer the questions below 2500 R(x) (100, 2 500) -2000 (80. 2000) (60, 1500) (100, 1 500) C(x) 1500 (60, 1300) (40, 1 200) (20, 1100) (80. 1 400) (50. 1250) Px) 4000 (0,1000) (40, 1000) (100. 1000) (80. 600) (20, 500) -500 (60, 200) (75, 500) 20 60 80 100 120 (0.0) (50. 0) Assume that z represents quantity and y is measured in dollars 1. How many items must this company sell to break even? Number items 2. the company sells 80 items, how much Profit would they make? Number 3. How many items should be sold to make $1000 in Revenue? Number tems 4. Evaluate the following from the graph above: (round to 2 decimal places necessary) R(60) - Number C (60) - Number P (0) - Number Č (60) - Number MP-Number

College Algebra (MindTap Course List)
12th Edition
ISBN:9781305652231
Author:R. David Gustafson, Jeff Hughes
Publisher:R. David Gustafson, Jeff Hughes
Chapter4: Polynomial And Rational Functions
Section4.1: Quadratic Functions
Problem 6SC: A company that makes and sells baseball caps has found that the total monthly cost C in dollars of...

Related questions
Question
will you help me figure this out
Transcribed Image Text:Use the following graph of Cost, Revenue, and Profit functions to answer the questions below
2500
R(x.
(100, 2500)
(80.2000)
(60, 1 500)
(100, 1 500) Cx)
4500
(60, 1300)
(40, 1200)
(20, 1100)
(80, 1 400)
(50. 1250)
Px)
(0, 1000)
(40, 1000)
(100, 1000)
(80. 600)
(20. 500)
600
(60, 200)
(75, 500)
20
60
100
120
(0.0)
(50. 0)
Assume that z represents quantity and y is measured in dollars
1. How many items must this company sell to break even? Number
items
2. If the company sells 80 items, how much Profit would they make? Number
3. How many items should be sold to make $1000 in Revenue? Number
items
4. Evaluate the following from the graph above: (round to 2 decimal places if necessary)
R(60) = Number
C (60) = Number
P (0) - Number
C (60) = Number
MP = Number
Expert Solution
Step 1
The graph of cost, revenue, and profit function is given as

Trending now
This is a popular solution!

Step by step
Solved in 2 steps with 1 images

Recommended textbooks for you
College Algebra (MindTap Course List)
Algebra
ISBN:
9781305652231
Author:
R. David Gustafson, Jeff Hughes
Publisher:
Cengage Learning

Mathematics For Machine Technology
Advanced Math
ISBN:
9781337798310
Author:
Peterson, John.
Publisher:
Cengage Learning,

Algebra: Structure And Method, Book 1
Algebra
ISBN:
9780395977224
Author:
Richard G. Brown, Mary P. Dolciani, Robert H. Sorgenfrey, William L. Cole
Publisher:
McDougal Littell
College Algebra (MindTap Course List)
Algebra
ISBN:
9781305652231
Author:
R. David Gustafson, Jeff Hughes
Publisher:
Cengage Learning
Mathematics For Machine Technology
Advanced Math
ISBN:
9781337798310
Author:
Peterson, John.
Publisher:
Cengage Learning,
Algebra: Structure And Method, Book 1
Algebra
ISBN:
9780395977224
Author:
Richard G. Brown, Mary P. Dolciani, Robert H. Sorgenfrey, William L. Cole
Publisher:
McDougal Littell

Algebra & Trigonometry with Analytic Geometry
Algebra
ISBN:
9781133382119
Author:
Swokowski
Publisher:
Cengage