Use the following information to answer the next three (3) questions. Regression analysis can be used to test whether the market efficiently uses information in valuing stocks. Let "return" be the total return from holding a firm's stock over the four-year period from the end of 1990 to the end of 1994. The efficient markets hypothesis says that these returns should not be systematically related to information known in 1990. If firm characteristics known at the beginning of the period help to predict stock returns, then we could use this information in choosing stocks. For 1990, let dkr be a firm's debt to capital ratio, let eps denote the earnings per share, let netinc denote net income, and let salary denote total compensation for the СЕО. There are 300 observations. The following equation was estimated: return = -14.37+.321dkr + .043eps – .0051netinc +.0035salary (.078) (.0047) (.0022) (6.89) (.201) R? = 0.0395 where the values in the parentheses are standard errors. Question 1 We reestimate the model and obtain the following results: return = -2.781+.0519salary (8.812) (.0191) R = 0.0112 We would like to test whether drk, eps and netinc are jointly significant in the original equation at the 5% significance level against a two-sided alternative. Calculate the F-statistics to test the null hypothesis. Round off your answer up to two decimal places.
Use the following information to answer the next three (3) questions. Regression analysis can be used to test whether the market efficiently uses information in valuing stocks. Let "return" be the total return from holding a firm's stock over the four-year period from the end of 1990 to the end of 1994. The efficient markets hypothesis says that these returns should not be systematically related to information known in 1990. If firm characteristics known at the beginning of the period help to predict stock returns, then we could use this information in choosing stocks. For 1990, let dkr be a firm's debt to capital ratio, let eps denote the earnings per share, let netinc denote net income, and let salary denote total compensation for the СЕО. There are 300 observations. The following equation was estimated: return = -14.37+.321dkr + .043eps – .0051netinc +.0035salary (.078) (.0047) (.0022) (6.89) (.201) R? = 0.0395 where the values in the parentheses are standard errors. Question 1 We reestimate the model and obtain the following results: return = -2.781+.0519salary (8.812) (.0191) R = 0.0112 We would like to test whether drk, eps and netinc are jointly significant in the original equation at the 5% significance level against a two-sided alternative. Calculate the F-statistics to test the null hypothesis. Round off your answer up to two decimal places.

College Algebra
7th Edition
ISBN:9781305115545
Author:James Stewart, Lothar Redlin, Saleem Watson
Publisher:James Stewart, Lothar Redlin, Saleem Watson
Chapter1: Equations And Graphs
Section: Chapter Questions
Problem 10T: Olympic Pole Vault The graph in Figure 7 indicates that in recent years the winning Olympic men’s...

Related questions
Question
2
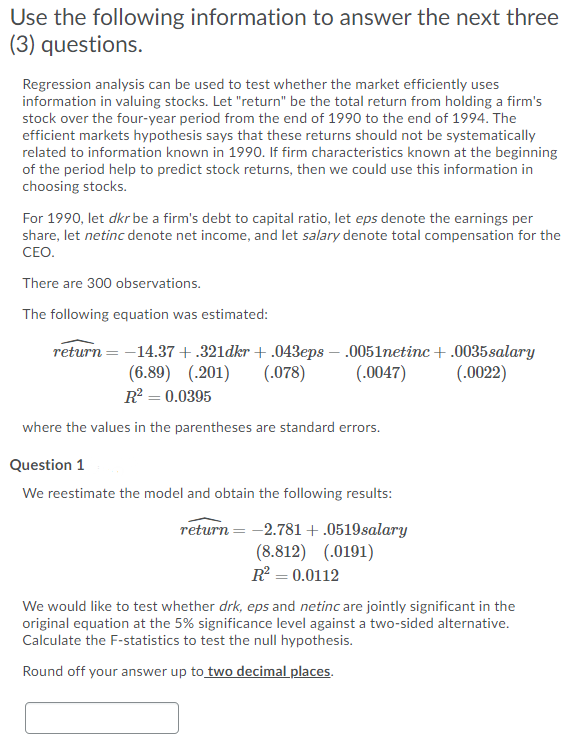
Transcribed Image Text:Use the following information to answer the next three
(3) questions.
Regression analysis can be used to test whether the market efficiently uses
information in valuing stocks. Let "return" be the total return from holding a firm's
stock over the four-year period from the end of 1990 to the end of 1994. The
efficient markets hypothesis says that these returns should not be systematically
related to information known in 1990. If firm characteristics known at the beginning
of the period help to predict stock returns, then we could use this information in
choosing stocks.
For 1990, let dkr be a firm's debt to capital ratio, let eps denote the earnings per
share, let netinc denote net income, and let salary denote total compensation for the
CEO.
There are 300 observations.
The following equation was estimated:
return = -14.37 +.321dkr + .043eps – .0051netinc +.0035salary
(.078)
(.0022)
(6.89) (.201)
R? = 0.0395
(.0047)
where the values in the parentheses are standard errors.
Question 1
We reestimate the model and obtain the following results:
return = -2.781+.0519salary
(8.812) (.0191)
R = 0.0112
We would like to test whether drk, eps and netinc are jointly significant in the
original equation at the 5% significance level against a two-sided alternative.
Calculate the F-statistics to test the null hypothesis.
Round off your answer up to two decimal places.
Expert Solution
This question has been solved!
Explore an expertly crafted, step-by-step solution for a thorough understanding of key concepts.

This is a popular solution!

Trending now
This is a popular solution!

Step by step
Solved in 2 steps

Recommended textbooks for you
College Algebra
Algebra
ISBN:
9781305115545
Author:
James Stewart, Lothar Redlin, Saleem Watson
Publisher:
Cengage Learning

Algebra and Trigonometry (MindTap Course List)
Algebra
ISBN:
9781305071742
Author:
James Stewart, Lothar Redlin, Saleem Watson
Publisher:
Cengage Learning

Linear Algebra: A Modern Introduction
Algebra
ISBN:
9781285463247
Author:
David Poole
Publisher:
Cengage Learning
College Algebra
Algebra
ISBN:
9781305115545
Author:
James Stewart, Lothar Redlin, Saleem Watson
Publisher:
Cengage Learning
Algebra and Trigonometry (MindTap Course List)
Algebra
ISBN:
9781305071742
Author:
James Stewart, Lothar Redlin, Saleem Watson
Publisher:
Cengage Learning
Linear Algebra: A Modern Introduction
Algebra
ISBN:
9781285463247
Author:
David Poole
Publisher:
Cengage Learning

Glencoe Algebra 1, Student Edition, 9780079039897…
Algebra
ISBN:
9780079039897
Author:
Carter
Publisher:
McGraw Hill

Trigonometry (MindTap Course List)
Trigonometry
ISBN:
9781305652224
Author:
Charles P. McKeague, Mark D. Turner
Publisher:
Cengage Learning

Algebra for College Students
Algebra
ISBN:
9781285195780
Author:
Jerome E. Kaufmann, Karen L. Schwitters
Publisher:
Cengage Learning