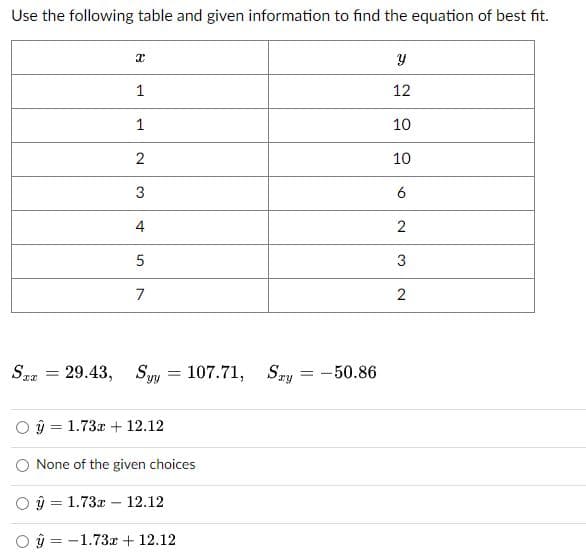
Use the following table and given information to find the equation of best fit. Sxx = X 1 1 2 3 4 5 7 29.43, Syy = 107.71, 9 1.73x + 12.12 None of the given choices O91.73x12.12 Oû-1.73x + 12.12 Sry -50.86 Y 12 10 10 6 2 3 2


Q: 40) Suppose that the sitting back-to-knee length for a group of adults has a normal distribution…
A: In the design of various seats, such as aircraft seats, train seats, theater seats, and classroom…
Q: a. Using the pairs of values for all 10 points, find the equation of the regression line. b. After…
A: The question is about regressionGiven :From scatterplot :To find :a ) Reg. eq. for all 10 pointsb )…
Q: 5. Tree Diagram (a) Draw a tree diagram to display all the possible outcomes that can occur when you…
A: Given that :A coin is flipped and then a die is tossed.
Q: What is the minimum value? 1 58 O 64 O 66 60 1 59 | (0 Height in Inches | 61 1 62 C | 63 O 58 O 61 1…
A: The given data in height (inches) 58, 59, 60, 61, 62, 63, 64, 65, 66Then,We will find the minimum…
Q: LITY & STATISTICS A car manufacturer claims that the average fuel efficiency of their latest model p…
A: Assume the population follows the normal distribution. Here, the population standard deviation is…
Q: (a) Write down the regression model. (b) Interpret the regression coefficient for the fitted model.…
A: The output from Minitab is given as-termsCoefSE coefT-valueP-valueVIFConstant…
Q: (b) Batu Pahat municipality rents bicycles for public use, which is open for 12 hours a day, has the…
A: P(X=k)=
Q: 3-) The followings are the number of visitors of a museum for randomly chosen seven days. Use 0.01…
A: 330,200,220,280,300,310,250sample size(n)=7significance level()=0.01
Q: Find the marginal probability density function (and the range) of X. Please provide
A:
Q: 3. A manufacturing firm wants to determine if there is a difference in the prices charged by two…
A: T-testThe t-test is one of the hypothesis tests which is used when the population standard deviation…
Q: Consider the following data: 15 19 23 19 16 15 24 20 21 25 m 12-14 15-17 18-20 21-23 24-26 24 18 17…
A: Solution-:Given…
Q: One study claimed that 86 % of college students identify themselves as procrastinators. A professor…
A: The question is about hypo. testingGiven :Popl. prop. of college stud. identify themselves as…
Q: 12. Counting: Outcomes You toss a pair of dice. (a) Determine the number of possible pairs of…
A: Each dice has 6 possible outcomes. Therefore, total pair of outcomes are given…
Q: Recorded here are the germination times (in days) for 10 randomly chosen seeds of a new type of…
A: According to the given information in this questionWe need to construct 99% confidence interval
Q: You may need to use the appropriate appendix table or technology to answer this question. A simple…
A: sample size(n)=40sample mean()=25population standard deviation()=5
Q: wo dice are rolled and what is the probability that the sum is 7?
A: Two dice are rolled
Q: A health institute wants to survey graduates from US medical schools to verify that the percentage…
A: As the institute estimates the percentage of graduates, who have accumulated at least $250000 is 30%…
Q: Find the mean
A: Consider the preliminary calculations given below:Daily low temperaturefrequency (f)Mid value (m)…
Q: The bank manager wants to show that the new system reduces typical customer waiting times to less…
A: It is given that:Sample size: Sample mean: Population standard deviation:
Q: (a) The probability that the event will occur is 0.375 (Type an integer or decimal rounded to the…
A: It is given that The odds of an event occurring = 3:5No. of outcomes will occur = 3No. of outcomes…
Q: If the probability that an event will happen is 0.27, what is the probability that the event won't…
A: Probability that event will happen = 0.27Probability that event will not happen = ?
Q: n exercise 2. 3 12 12 6 20 20 14 Y; 55 40 55 10 15 deviation of when x = 8. interval for the…
A: :Given the data set are xy355124065520101415The Equation of Simple Linear Regression :Y =β0 +β1x +…
Q: Based on the data shown below, calculate the correlation coefficient (to three decimal places) X y 4…
A:
Q: Annual high temperatures in a certain location have been tracked for several years. Let X represent…
A: Solution-:Let, X=be the year and Y= High temperatureWe have following data:…
Q: Heights (cm) and weights (kg) are measured for 100 randomly selected adult males, and range from…
A: According to the given information in this questionWe need to find the best predicted value
Q: Express the confidence interval 121.7 << 289.5 in the form of + ME. T + ME +
A: Confidence Interval is 121.7<<289.5Lower confidence level=121.7Upper confidence level=289.5
Q: Use the set notation symbols (∪,',∩) and set labels from the given information to express each of…
A: A survey of outdoor recreation enthusiasts had 5,238 responses.Let the following subsets be…
Q: Select the correct choice below and fill in the answer box to complete your choice. (Round to three…
A: It is given that the data show the number of overtime hours worked in one week per employee.
Q: The diagram below shows a graph of a normal curve. The mean and the number of standard deviations…
A: Mean Standard deviation
Q: (a) Show that in order for f(x) to be a valid p.d.f. over the range (0, 2), the normalising constant…
A:
Q: Using a 5% level of significance, test the hypothesis that more than 3% of their electric vehicles…
A: Here From given informationClaim : An electric automobile manufacturer states that 3% or less of its…
Q: III. Solve the following problems below. Also, draw the corresponding graph. 1. The probability that…
A: 1) z score corresponding to 1.25 = - 2.24z score corresponding to 1.75 = - 0.75
Q: Consider the below table. What is the lower bound for the confidence interval of t proportion?…
A: A confidence interval includes a range of values within which the population parameter is expected…
Q: To investigate the risk factors associated with developing gestational diabetes mellitus (GDM), 4320…
A: Given information isGDM : n1 = 633 s1 = 5.16And Non GDM : n2 = 3687 s2 = 5.21
Q: Question 4 Around 37 degrees Centigrade is normal body temperature for children and adults. Fever is…
A: In this problem, we are given data on the temperatures of 80 patients who had a fever and were…
Q: Assume that adults were randomly selected for a poll. They were asked if they "favor or oppose using…
A: The information provided in the question are as follows :-Number of adults in favor = 489Number of…
Q: There are six men and seven women in a class. If four men and four women are chosen and paired off;…
A: The selection of items from a larger set without regard to the order of selection is termed…
Q: Records on a fleet of trucks reveal that the average life of a set of spark plugs is normally…
A: Sample size=n=18Sample mean=x̄=23400,Sample standard deviation=s=1412 Population mean=µ=22100Level…
Q: In a student survey, forty-one part-time students were asked how many courses they were taking this…
A: # of coursesFrequencyRelative frequencyCumulative frequency1a0.1707c221b283130.317141Complete table…
Q: 34) Computers are commonly used to randomly generate digits of telephone numbers to be called when…
A:
Q: The 156 heights of m range rule of thumb t calculated using the rule of thumb? Assu
A: Here given Maximum value = 193.7 cmMinimum value = 159 cm
Q: a. Sketch the density curve. b. Determine the likelihood a student spends between 11 and 17 minutes…
A:
Q: If np≥5 and nq≥5,estimate P(fewer than 5) with n=13 and p=0.4 by using the normal distribution as…
A: Sample size(n) = 13Probability of success(p) = 0.4X = No. of successesP(x<5) = ?
Q: SOLVE STEP BY STEP IN DIGITAL FORMAT If 6 9 2 Yi 7 18 13 20 9 26 23 Obtain the 95% confidence and…
A: To solve this problem, we will perform a linear regression analysis using the given data points. By…
Q: The following are absence rates from work for a sample of 14 employers in England. 4.2 7.4 5.8 4.8…
A: Rates5.35.87.55.15.35.15.38.16.55.96.15.3
Q: In order to estimate the average time spent per student on the computer terminals at a local…
A: sample size(n) = 81population standard deviation = 1.5 hoursstandard error for mean = ?
Q: Claim: Most adults would erase all of their personal information online if they could. A software…
A:
Q: h subject in a sample of 100 men and 100 women is asked to indicate which of the following factors…
A: Chi-square Distribution test is:
Q: Consider the following scenario: A researcher is studying if an individual’s employment status…
A: The 2 variables are individual’s employment status and individual's number of years of education and…
Q: A market research survey is available for no cost. Using a decision tree analysis, it is found that…
A: According to the given information in this questionWe need to find EVSI
Please do not give solution in image format thanku

Step by step
Solved in 3 steps with 5 images

- A teacher finds that for test grades in Class A, x̄ = 32 and S x = 4; for test grades in Class B, x̄ = 32 and S x = 8.a. What score should he predict for students in each class? b. Which class permits the better predictions? Why?Find a particular solution correctly toTo receive a C grade, a student must average more than 77 but less than or equal to 85. If Noah received a C in the course and had five grades of 73, 85, 73, 69, and 78 before taking the final exam, what were the possible grades for his final if there were 100 points possible? (Assume all six grades are weighted equally and let x represent the unknown score.)
- The line of best fit through a set of data is y=29.267+0.881xAccording to this equation, what is the predicted value of the dependent variable when the independent variable has value 60?y =Find the particular solution ofFind an equation of the form y=abx+csin(π2x)y=abx+csin(π2x) that fits the data below
- In comparing the average protein content µ1 and µ2 of two brands of dog food, a consumer testing service finds that fifty 5-pund packages of brand A dog food had an average protein content x̅1=11 ounces per package and a s.d of s1 = 1 ounce, while sixty-5 pound packages of brand B dog food has an average protein content x̅2=9ounces per package and a s.d of s2 = 0.5 ounce. A difference of 0.5 ounces is considered to be not sufficiently important to report as a consumer issue. Therefore, a decision was made to test the hypothesis.The following table was generated from the sample data of 1010 junior high students regarding the average number of hours they are unsupervised per night, the average number of hours they play video games per night, and their final grades in their math class. The dependent variable is the final grade, the first independent variable (x1x1) is the number of hours unsupervised each night, and the second independent variable (x2x2) is the number of hours of video games each night. Coefficients Standard Error t-Stat p-value Intercept 64.49590764.495907 5.9533305.953330 10.83358510.833585 0.0000370.000037 Hours Unsupervised −0.974079−0.974079 1.1097971.109797 −0.877709−0.877709 0.4138620.413862 Hours Playing Video Games 4.9768084.976808 1.0636721.063672 4.6788924.678892 0.0034000.003400 Step 1 of 2: Write the multiple regression equation for the computer output given. Round your answers to three decimal places. Step 2 of 2: Indicate if any of the independent variables…The following table was generated from the sample data of 1010 junior high students regarding the average number of hours they are unsupervised per night, the average number of hours they play video games per night, and their final grades in their math class. The dependent variable is the final grade, the first independent variable (x1x1) is the number of hours unsupervised each night, and the second independent variable (x2x2) is the number of hours of video games each night. Intercept 64.821745 4.918050 13.180375 0.000012 Hours Unsupervised -1.691108 1.396989 -1.210538 0.271590 Hours Playing Video Games 6.796882 1.515248 4.485657 0.004167 Step 1 of 2: Write the multiple regression equation for the computer output given. Round your answers to three decimal places. Step 2 of 2: Indicate if any of the independent variables could be eliminated at the 0.050.05 level of significance.
- The following table was generated from the sample data of 1010 junior high students regarding the average number of hours they are unsupervised per night, the average number of hours they play video games per night, and their final grades in their math class. The dependent variable is the final grade, the first independent variable (x1x1) is the number of hours unsupervised each night, and the second independent variable (x2x2) is the number of hours of video games each night. Coefficients Standard Error t-Stat p-value Intercept 57.968435 7.227955 8.020032 0.000201 Hours Unsupervised 5.131630 1.314283 3.904510 0.007943 Hours Playing Video Games 1.067855 1.615039 0.661194 0.533040 Write the multiple regression equation for the computer output given. Round your answers to three decimal places.The following table was generated from the sample data of 1010 junior high students regarding the average number of hours they are unsupervised per night, the average number of hours they play video games per night, and their final grades in their math class. The dependent variable is the final grade, the first independent variable (x1x1) is the number of hours unsupervised each night, and the second independent variable (x2x2) is the number of hours of video games each night. Coefficients Standard Error t-Stat p-value Intercept 57.968435 7.227955 8.020032 0.000201 Hours Unsupervised 5.131630 1.314283 3.904510 0.007943 Hours Playing Video Games 1.067855 1.615039 0.661194 0.533040 Indicate if any of the independent variables could be eliminated at theGet a particular solution
