Use the frequency histogram to complete the following parts. Employee Salaries 300 (a) Determine the number of classes. (b) Estimate the greatest and least frequencies. (c) Determine the class width. (d) Describe any patterns with the data. 200- 100- 34.5 44.5 54.5 64.5 74.5 84.5 94.5 Salary (in thousands of dollars) (c) The class width is (Type an integer or a decimal. Do not round.) (d) What pattern does the histogram show? O A. About half of the employees' salaries are between $50,000 and $69,000. O B. Most employees make less than $39,000 or more than $90,000. O c. About half of the employees' salaries are between $70,000 and $89,000. O D. Less than half of the employees make between $40,000 and $89,000. Kouenbej
Use the frequency histogram to complete the following parts. Employee Salaries 300 (a) Determine the number of classes. (b) Estimate the greatest and least frequencies. (c) Determine the class width. (d) Describe any patterns with the data. 200- 100- 34.5 44.5 54.5 64.5 74.5 84.5 94.5 Salary (in thousands of dollars) (c) The class width is (Type an integer or a decimal. Do not round.) (d) What pattern does the histogram show? O A. About half of the employees' salaries are between $50,000 and $69,000. O B. Most employees make less than $39,000 or more than $90,000. O c. About half of the employees' salaries are between $70,000 and $89,000. O D. Less than half of the employees make between $40,000 and $89,000. Kouenbej

Glencoe Algebra 1, Student Edition, 9780079039897, 0079039898, 2018
18th Edition
ISBN:9780079039897
Author:Carter
Publisher:Carter
Chapter10: Statistics
Section: Chapter Questions
Problem 26SGR

Related questions
Question
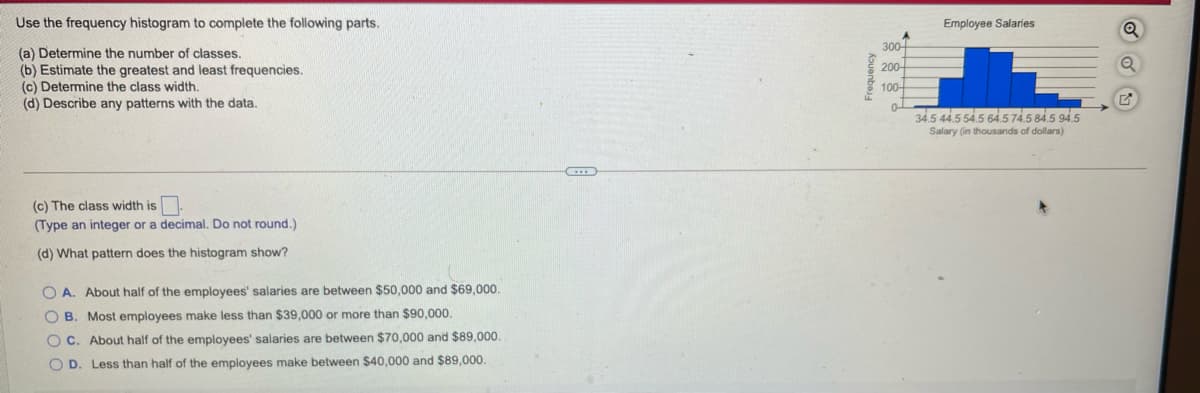
Transcribed Image Text:Use the frequency histogram to complete the following parts.
Employee Salaries
300-
(a) Determine the number of classes.
(b) Estimate the greatest and least frequencies.
(c) Determine the class width.
(d) Describe any patterns with the data.
200-
100-
0-
34.5 44.5 54.5 64.5 74.5 84.5 94.5
Salary (in thousands of dollars)
(c) The class width is
(Type an integer or a decimal. Do not round.)
(d) What pattern does the histogram show?
O A. About half of the employees' salaries are between $50,000 and $69,000
O B. Most employees make less than $39,000 or more than $90,000.
O C. About half of the employees' salaries are between $70,000 and $89,000.
O D. Less than half of the employees make between $40,000 and $89,000.
Frequency
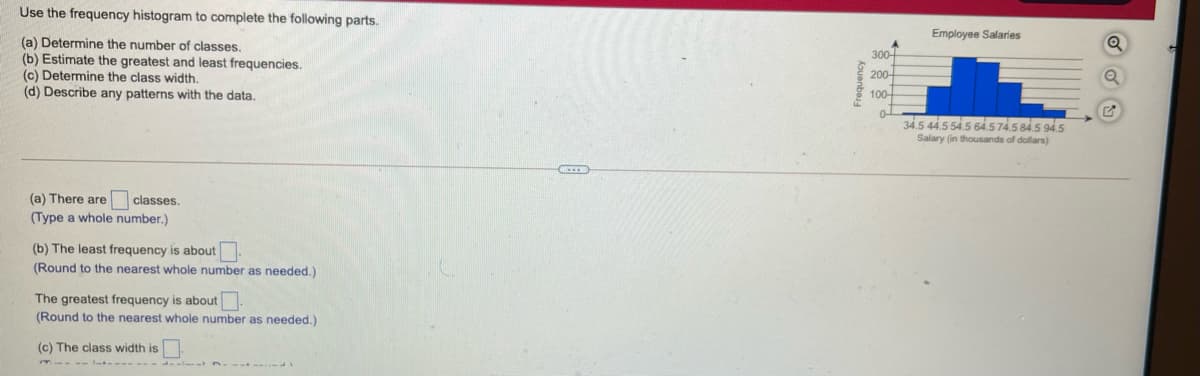
Transcribed Image Text:Use the frequency histogram to complete the following parts.
Employee Salaries
300
(a) Determine the number of classes.
(b) Estimate the greatest and least frequencies.
(c) Determine the class width.
(d) Describe any patterns with the data.
200-
100-
34.5 44 5 545 645745 845 94.5
Salary (in thousands of dollars)
classes.
(Type a whole number.)
(a) There are
(b) The least frequency is about
(Round to the nearest whole number as needed.)
The greatest frequency is about
(Round to the nearest whole number as needed.)
(c) The class width is
Kouenbej
Expert Solution
This question has been solved!
Explore an expertly crafted, step-by-step solution for a thorough understanding of key concepts.

This is a popular solution!

Trending now
This is a popular solution!

Step by step
Solved in 2 steps

Recommended textbooks for you
Glencoe Algebra 1, Student Edition, 9780079039897…
Algebra
ISBN:
9780079039897
Author:
Carter
Publisher:
McGraw Hill

Holt Mcdougal Larson Pre-algebra: Student Edition…
Algebra
ISBN:
9780547587776
Author:
HOLT MCDOUGAL
Publisher:
HOLT MCDOUGAL
Glencoe Algebra 1, Student Edition, 9780079039897…
Algebra
ISBN:
9780079039897
Author:
Carter
Publisher:
McGraw Hill
Holt Mcdougal Larson Pre-algebra: Student Edition…
Algebra
ISBN:
9780547587776
Author:
HOLT MCDOUGAL
Publisher:
HOLT MCDOUGAL