Loan Purpose Months Customer Small Appliance 12 Furniture 28 New Car 21


Q: If x and y are two uncorrelated variables and u=x+y, v =x- y, find the coefficient of correlation…
A:
Q: For the periods 2014 to 2019, ESKOM’s electricity percentage price adjustments are given in the…
A: We have to calculate geometric mean, We have to compare geometric mean with average. Geometric Mean…
Q: Assume S = $45, σ = 0.25, r = 0.05, div = 0.0, on a 45 strike call and 55 days until expiration.…
A:
Q: previous studies it is found that the standard devotion of B can be e A two-tailed test on a 99%…
A:
Q: A CD case contains 10 jazz albums, 4 classical albums, and 2 soundtracks. Choose 3 at random to put…
A: Given that A CD case contains Jazz albums = 10 Classical albums = 4 Soundtrack = 2 Total = 10+4 +2…
Q: In a batch of 1960 calculators, there are, on average, 10 defective ones. If a random sample of 147…
A: We have given that, Let X be the number of defective units from binomial distribution and sample…
Q: (b) Alice and Bob are playing a game of chance consisting of repeated rounds in which each has an…
A:
Q: A multiple-choice quiz has 6 questions and5 possible answers per question. How many different ways…
A: We have given that Number of multiple choice questions = 6 Each question has number of possible…
Q: A market research firm interested in finding out the effects of increasing the length of…
A: Given a scenario, we have to choose which type of research design is being used.
Q: compare the variance of the number of correct picks on a "take Five" ticket? compute the standard…
A:
Q: 6.26 Use Theorem 6.6.5 to establish that, given a sample X1,..., Xn, the following statistics are…
A: Given that -
Q: Use the data provided to find the proportion of respondents who own Dell, Apple, and HP computers.
A:
Q: Use the Relationships Among the Chi-Squared Test Statistic, P-Value, and Goodness-of-Fit flow chart…
A: First of all, it is known that the goodness of fit test is used for testing the equivalence between…
Q: Use the geyser eruption duration times in seconds and the accompanying 200 bootstrap samples…
A: Given that - Use the geyser eruption duration times in seconds and the accompanying 200…
Q: The stock of a warehouse consists of boxes of high, medium and low quality lightbulbs in respective…
A: The answer is attached below,
Q: 2. Five 2 cm thick experimental pieces of an insulation material were tested at random. Resulted…
A: Use the Excel and Perform the Regression. Followings are the Steps to perform the Regression 1) Open…
Q: QUESTION 20 "When running a t-test, it is essential that you select the right one for your…
A:
Q: In two sets of variables X and Y with 50 observations each, the following data were observed X = 10,…
A:
Q: The concentration of a certain active agent in a liquid form of a pesticide must not exceed 12 parts…
A: Since it is not mentioned which question to be answered, we'll be answering the first question only.…
Q: Given the following results of the height and weight of 1,000 men students : 3=68", X-150 lbs, 960,…
A:
Q: and red) totaling 25 balls. If ive blue balls are added to he probability of drawing a vill be…
A: *Answer:
Q: There are 20 black cell phones and 30 white cell phones in a store. An employee takes 10 phones at…
A: here given , There are 20 black cell phones and 30 white cell phones in a store. Anemployee takes 10…
Q: A researcher claims that 20-year old women on a special diet will have an average weight of less…
A: Use the Excel and Calculate the Sample Mean and Sample Standard Deviation
Q: A box contains 20 chocolates. 5 of the chocolates are black chocolate flavour while the balances are…
A:
Q: Cumulative Labor-Hours by the Number of Weeks after Job Begins Weeks (x) Hours (f) 23 4 156 7 1253…
A:
Q: Answer the given word problem by performing the test of hypothesis using t- test with two unequal…
A: Given Data : For Sample 1 x̄1 = 24.27 s1 = 4.98 n1 = 10 For Sample 2 x̄2 =…
Q: At a certain restaurant, there is a 60% probability that the candles on your table will be red. If…
A:
Q: O Q 1. Choose the best answer. In a high school high jump contest, the height of clearing the bar…
A:
Q: 12) The Human Resource department of Lala firm has summarized the number of service years of their…
A:
Q: The Journal de Botanique reported that the mean height of Begonias grown while being treated with a…
A: Given n=14 Alpha=0.10 Standard deviations=9
Q: QUESTION 19 Results that are significant indicate that the data has proven your hypothesis. True O…
A: From the given information in question We answer the correct option
Q: A diagnostic test is being developed to identify two groups of patients, those are given in the…
A: Threshold value is given =58 Means ( test results above 58 is positive test for exposure) We have to…
Q: The psd of X(t) is given by (1+@² for | @|<1 Sxx (@) otherwise Find the autocorrelation function.
A:
Q: PROBLEM-3: A dietitian receives the salary in the table below annually. The consumer price index is…
A:
Q: The table below lists the number of games played in the baseball World Series as of 2013. In the…
A: It is needed to test, whether the actual numbers of games played fit the distribution implied by the…
Q: The weights of 40 pupils are shown below 35 43 52 39 62 54 58 37 44 62 43 48 53 42 55 37 45 50 40 46…
A: Given that -
Q: Which of the following is a probabilistic sampling approach that does not require the use of a…
A: Non-probability sampling does not require the use of a sampling frame.
Q: If, in a (two-tail) hypothesis test, the p-value is 0.0803, what is your statistical decision if you…
A:
Q: 3. Borkiewicz has given the following data of men killed by the kick of a horse in certain Prussian…
A:
Q: (a) A random variable X is defined as the larger of the scores obtained in two throws of an…
A: We need to show that, P(X=x) = (2x-1)36
Q: If the sample size is n=16 what is likely true about the shape of the population?
A: Solution: Central limit theorem: The central limit theorem state that as the sample size increases…
Q: A survey asked, "How many tattoos do you currently have on your body?" Of the 1218 males surveyed,…
A: Given Information: n1=1218a1=191p1=1911218=0.1568n2=1011a2=191p2=1911011=0.1246
Q: Q.10) a) What are the differences between the data and information? b) Explain the differences…
A: a) DATA is a collection of facts, while INFORMATION puts those facts into context. DATA: Data is…
Q: Let x indicate the number of pairs of shoes produced. Develop a mathematical model for the total…
A: The O'Neill Shoe Manufacturing Company will produce a special-style shoe if the order size is large…
Q: A committee has 10 members and 4 members must be chosen for a subcommittee. Three of the 10 members…
A: Statisticians/mathematicians use different counting techniques while selecting or arranging members…
Q: X(t) is a stationary random process with spectral density Sr (@). Y(t) is another independent random…
A:
Q: 4. Let X be a random variable with values 2, 3, 5, and 6. Find the sampling distribution of the mean…
A: here given population 2,3,5 and 6 here sample of size n =2 are selected
Q: For the periods 2014 to 2019, ESKOM’s electricity percentage price adjustments are given in the…
A: Given the Average percentage price adjustments for the periods 2014 to 2019 as Year Percentage…
Q: The Brand A cellphone company claims that its phones have an almost the same lifespan as of the…
A: There are two independent samples which are Brand A and Brand B. We have to test whether phones have…
Q: An investor invests in a security with an 80% chance of earning Php60,000 and a 20% chance of losing…
A:
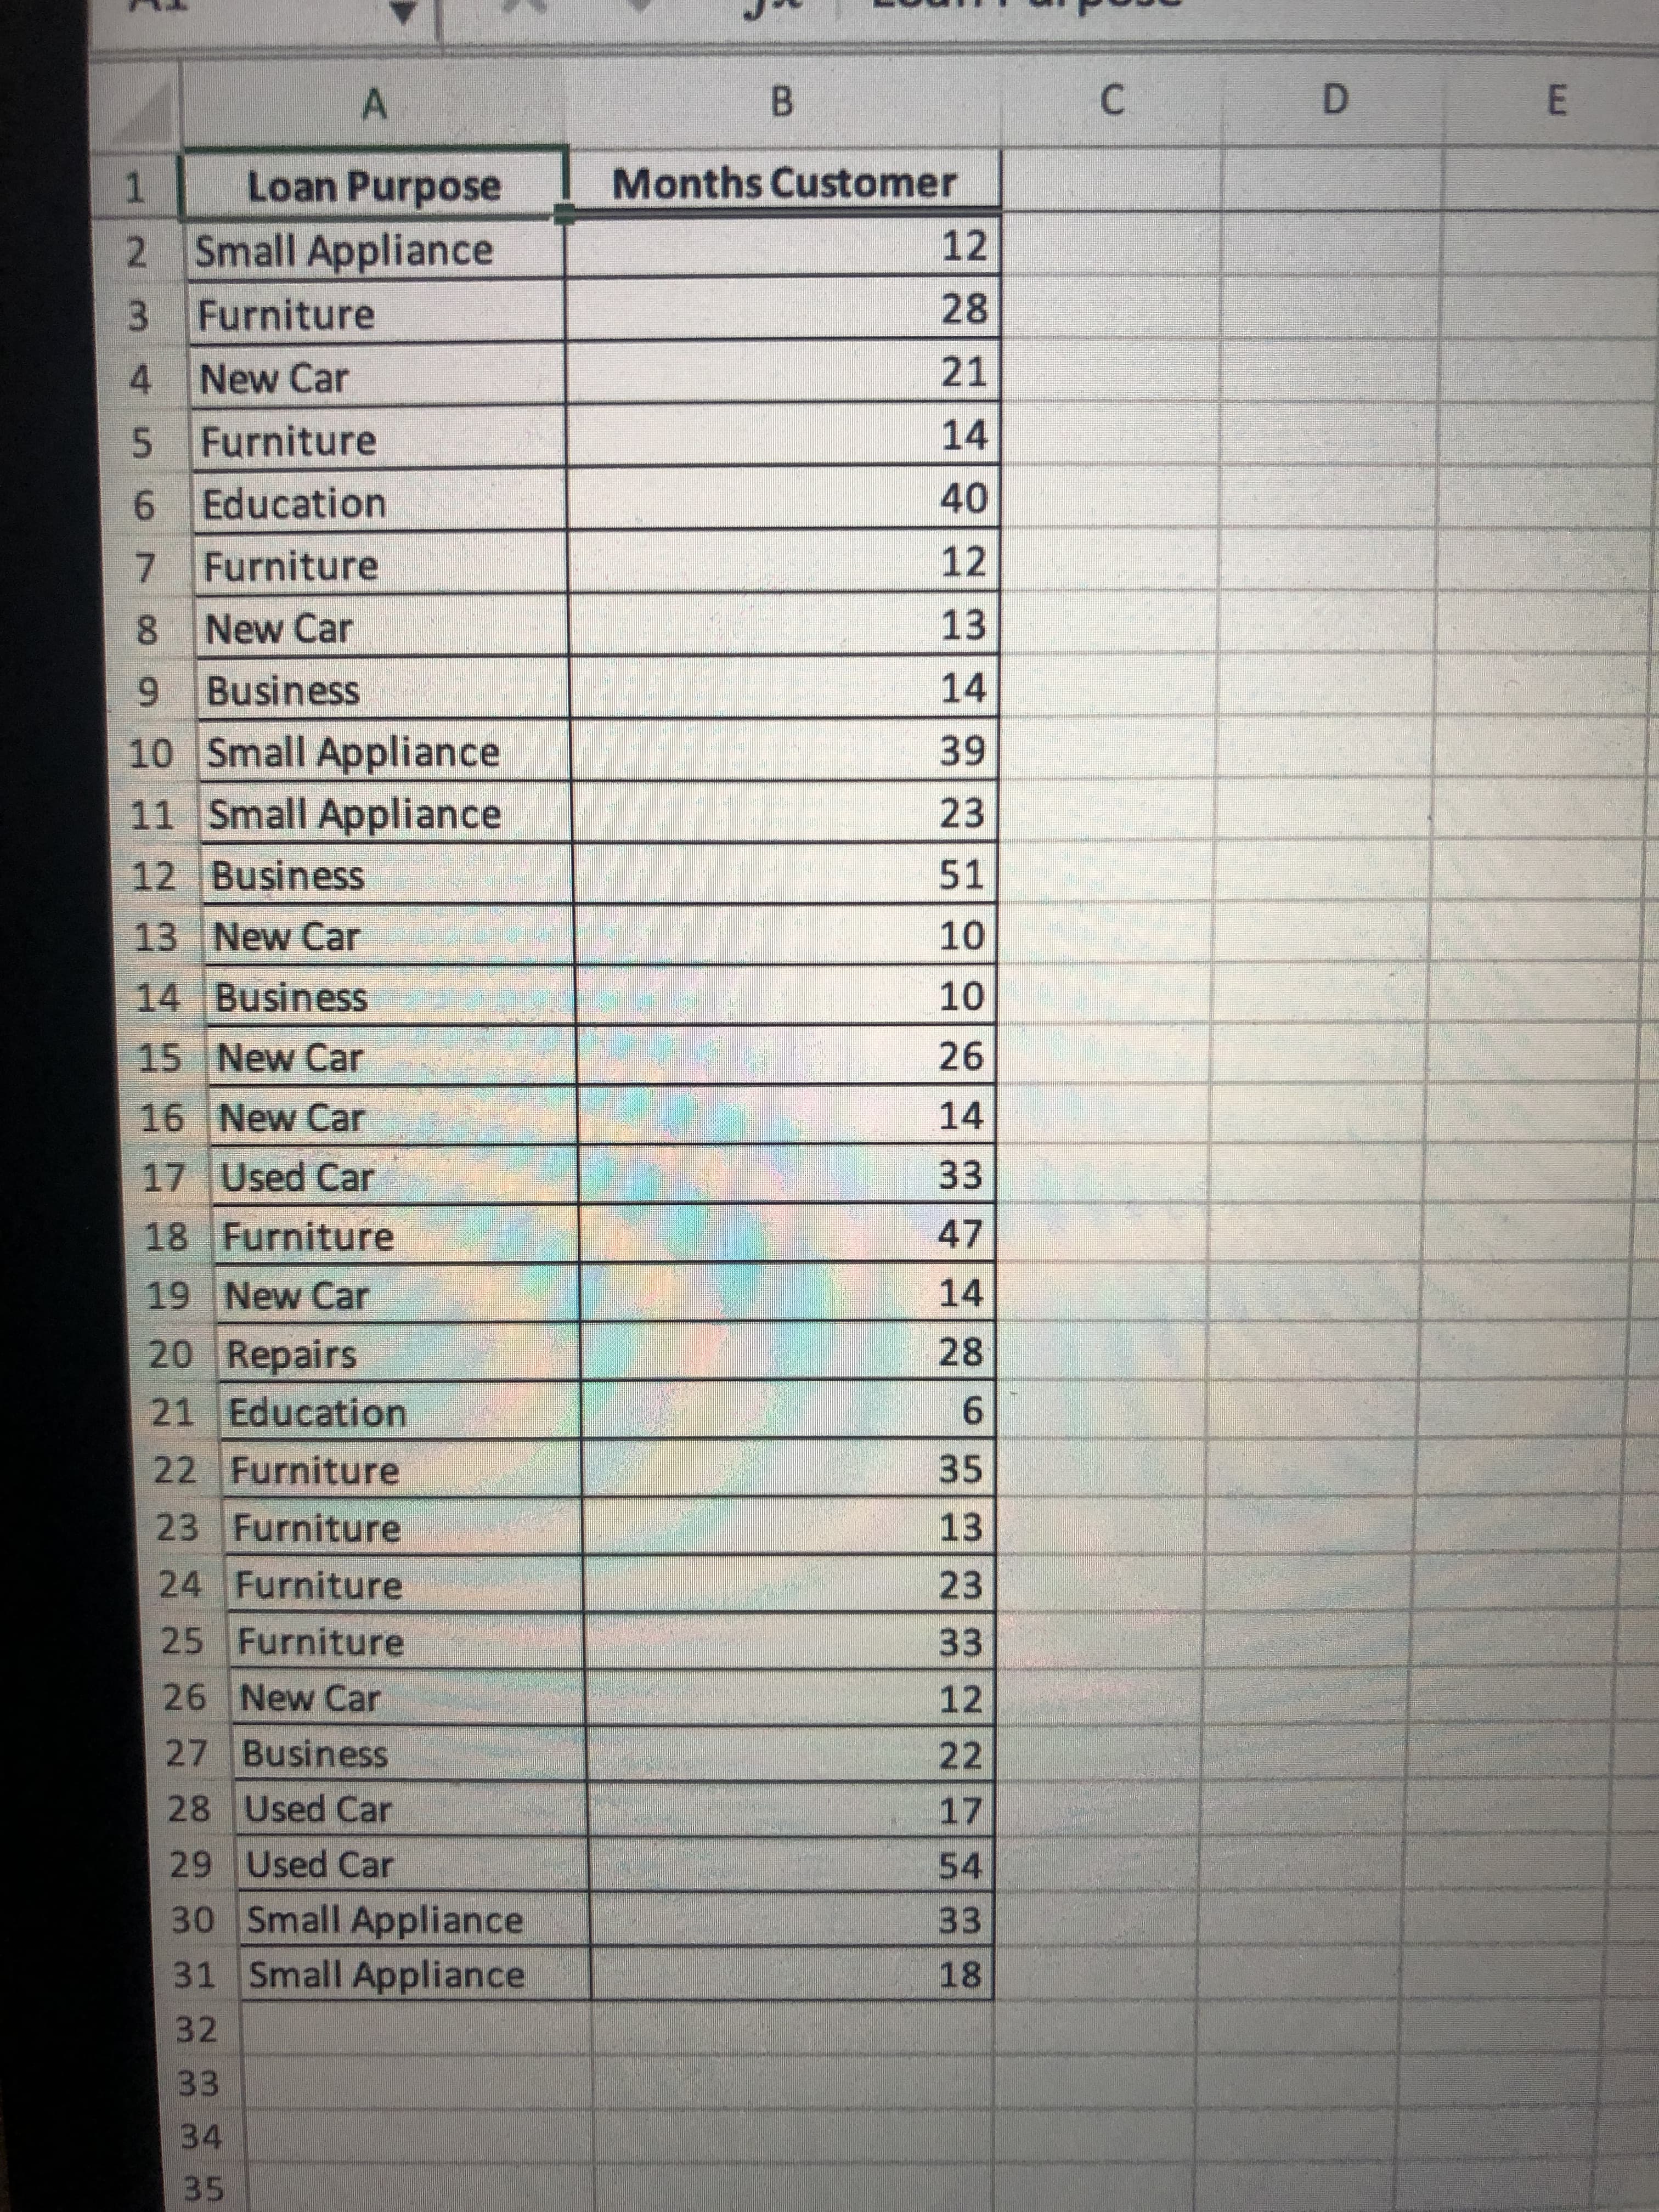
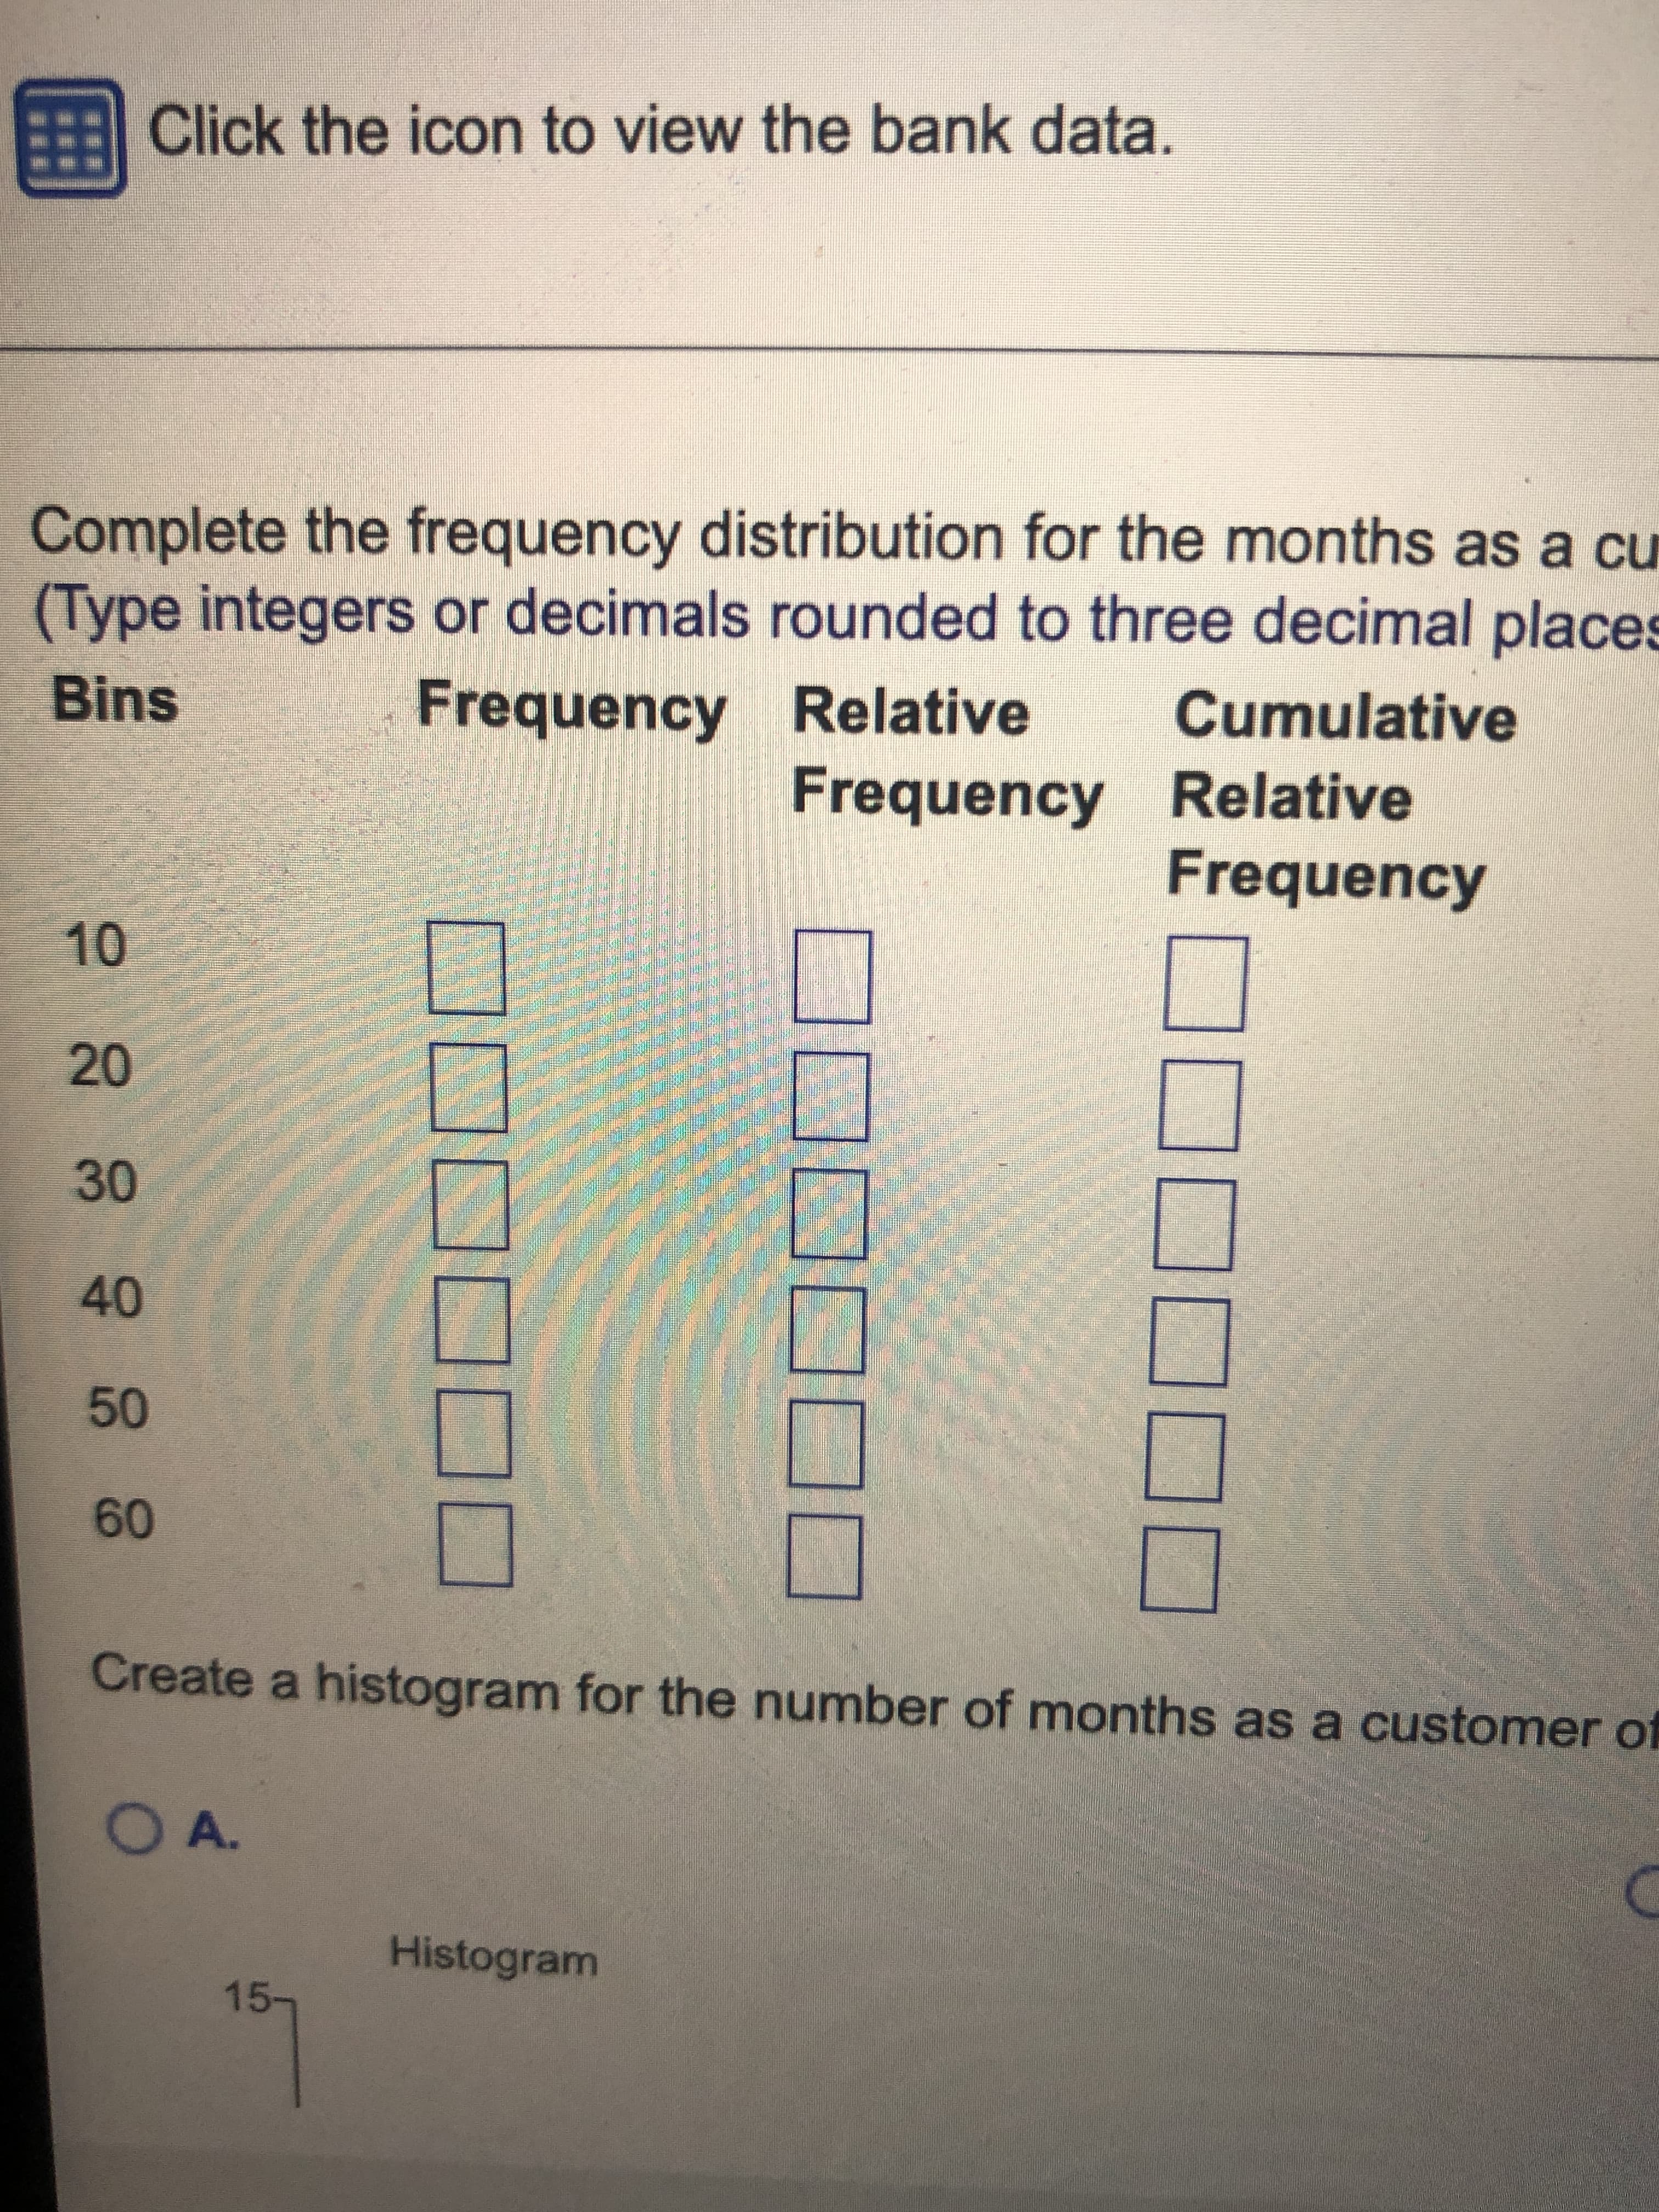
Use the histogram tool to develop a frequency distribution and histogram for the number of months as a customer of the bank in the data below. Compute the relative and cumulative relative frequencies and use a line chart to construct an ogive.

Step by step
Solved in 2 steps with 2 images

- Company Name Revenue Capitalization Avis Budget Group -29 1175.8 United Stationers 109 1381.6 Owens Corning 276 3417.8 Foot Locker 278 3547.6 Alliant Techsystems 313.2 1891.9 Fidelity National Financial 369.5 3461.4 FMC Technologies 399.8 12520.3 Ralph Lauren 567.6 12522.8 Ralph Lauren 567.6 12522.8 Harley-Davidson 599.1 8925.3 Kroger 602 13819.5 Pitney Bowes 617.5 3681.2 Pitney Bowes 617.5 3681.2 Amazon.com 631 81458.6 Rockwell Collins 634 8560.5 Rockwell Automation 697.8 10514.8 Rockwell Automation 697.8 10514.8 AmerisourceBergen 706.6 10087.6 Delta Air Lines 854 7082.1 Cardinal Health 959 14115.2 Medco Health Solutions 1,455.70 21865.9 Costco Wholesale 1,462.00 36461.2 HCA Holdings 2,465.00 9550.2 Lockheed Martin 2,655.00 26651.1 CVS Caremark 3,461.00 53575.7 Kraft Foods 3,527.00 65917.4 Boeing 4,018.00 55188.8 United Technologies 4,979.00 66606.5 UnitedHealth Group 5,142.00 53469.4 Cisco Systems 6,490.00 97376.2…Company Competitor 1383 1153 2022 1067 2429 1296 901 1406 2219 1254 1896 1335 1910 1204 1539 1076 2048 1246 2881 1098 2395 1258 1349 955 2052 954 2675 1363 1588 1022 2704 1155 3148 1807 2822 1295 2217 1116 2260 1323 3040 1326 3137 1107 2977 1163 2599 1254 2412 1017 3187 938 2598 1270 2995 1042 3046 1318 3858 1497 2438 750 3243 1380 2764 1053 2944 932 3324 1097 2797 1193 3914 1271 2766 843 2273 780 3052 1095 3202 1290 3672 937 3957 1390 3274 1056 3788 1235 3502 1235 2942 999 3078 1066 3196 641 3141 1322 3579 1289 3895 1060 above is the excel data, please solve the excel part with formulas and explanation, thanksThe chief loan officer of La Crosse Home Mortgage Company summarized the housing loans extended by the company in 2017 according to type and term of the loan. Her list shows that 60% of the loans were fixed-rate mortgages (F), 30%were adjustable-rate mortgages (A), and 10% belong to some other category (O) (mostly second trust-deed loans and home equity loans). Of the fixed-rate mortgages, 75% were 30-year loans and 25% were 15-year loans; of the adjustable-rate mortgages, 30% were 30-year loans and 70% were 15-year loans; finally, of the other loans extended, 25% were 20-year loans, 60% were 10-year loans, and 15% were for a term of 5 years or less. What is the probability that a home loan extended by La Crosse has an adjustable rate and is for a term of 15 years? What is the probability that a home loan extended by La Crosse is for a term of 15 years?
- NORTH–SOUTH AIRLINE CASENorthern Airline DataAirframe CostEngine CostAverage AgeYearper Aircraftper Aircraft(Hours)200151.8043.496,512200254.9238.588,404200369.7051.4811,077200468.9058.7211,717200563.7245.4713,2752006 84.7350.2615,215200778.7479.6018,390Southeast Airline DataAirframe CostEngine CostAverage AgeYearPer Aircraftper Aircraft(Hours)200113.2918.865,107200225.1531.558,145200332.1840.437,360200431.7822.105,773200525.3419.697,150200632.7832.589,364200735.5638.078,2591. Develop Regression equations for each cost category as dependent variables and average age as independent variables. Do this for each Airline. Look at graphs produced by QM2. From the regression results, what would you conclude about a) airframe vs engine costs for each airlineb) comparing airlines as to airframe costsc) comparing airlines as to engine costsd) Provide a brief summary report of your comparisonsstate abb region population total 1 Alabama AL South 4779736 135 2 Alaska AK West 710231 19 3 Arizona AZ West 6392017 232 4 Arkansas AR South 2915918 93 5 California CA West 37253956 1257 6 Colorado CO West 5029196 65 7 Connecticut CT Northeast 3574097 97 8 Delaware DE South 897934 38 9 District of Columbia DC South 601723 99 10 Florida FL South 19687653 669 11 Georgia GA South 9920000 376 12 Hawaii HI West 1360301 7 13 Idaho ID West 1567582 12 14 Illinois IL North Central 12830632 364 15 Indiana IN North Central 6483802 142 16 Iowa IA North Central 3046355 21 17…state abb region population total 1 Alabama AL South 4779736 135 2 Alaska AK West 710231 19 3 Arizona AZ West 6392017 232 4 Arkansas AR South 2915918 93 5 California CA West 37253956 1257 6 Colorado CO West 5029196 65 7 Connecticut CT Northeast 3574097 97 8 Delaware DE South 897934 38 9 District of Columbia DC South 601723 99 10 Florida FL South 19687653 669 11 Georgia GA South 9920000 376 12 Hawaii HI West 1360301 7 13 Idaho ID West 1567582 12 14 Illinois IL North Central 12830632 364 15 Indiana IN North Central 6483802 142 16 Iowa IA North Central 3046355 21 17…
- U.S. Manufactured General Aviation Shipments, 2009–2015 Year Qtr 1 Qtr 2 Qtr 3 Qtr 4 Total 2009 310 408 390 477 1,585 2010 243 377 281 433 1,334 2011 268 289 286 480 1,323 2012 305 358 339 514 1,516 2013 329 413 353 520 1,615 2014 345 380 379 527 1,631 2015 296 374 378 544 1,592 Use MegaStat or Minitab to calculate estimated seasonal indexes and trend. Q1. Q2. Q3. Q4 In which quarters are shipments highest? Lowest?sellprice listprice LIVINGAREA ROOMS BEDRMS BATHRMS AGE ACRES TAXES 710.00 800 28 10 5 3 60 0.28 3167 875.00 900 18 8 4 1 12 0.43 4033 645.00 660 13 6 3 1 41 0.33 1471 690.00 700 17 7 3 1 22 0.46 3204 1160.00 1200 25 8 4 3 5 2.05 3613 675.00 700 18 7 4 3 9 0.57 3028 750.00 800 20 8 4 3 18 4.00 3131 1035.00 1125 22 8 4 2 16 2.22 5158 1355.00 1425 30 10 5 2 30 0.53 5702 445.00 450 10 5 3 1 43 0.30 2054 765.00 785 22 8 3 3 18 0.38 4127 432.50 450 16 7 3 1 50 0.65 1445 1170.00 1190 25 8 4 2 2 1.61 2087 527.50 580 20 8 4 1 13 0.22 2818 875.00 900 22 8 4 2 15 2.06 3917 825.00 850 17 8 4 2 33 0.46 2220 830.00 850 23 9 4 2 37 0.27 3498 680.00 700 19 7 3 1 22 0.63 3607 740.00 800 17 7 3 2 13 0.36 3648 755.00 765 19 8 4 2 24 0.34 3561 900.00 950 24 9 4 2 10 1.55 4681 1465.00 1525 26 8 4 3 6 0.46 7088 835.00 850 20 9 4 2 46 0.46 3482 950.00 965 22 9 5 2 37 0.48 3920 920.00 950 21 9 5 2 27 1.30 4162 785.00 825 20 8 4 2 7 0.30 3785 550.00 575 16…sellprice listprice LIVINGAREA ROOMS BEDRMS BATHRMS AGE ACRES TAXES 710.00 800 28 10 5 3 60 0.28 3167 875.00 900 18 8 4 1 12 0.43 4033 645.00 660 13 6 3 1 41 0.33 1471 690.00 700 17 7 3 1 22 0.46 3204 1160.00 1200 25 8 4 3 5 2.05 3613 675.00 700 18 7 4 3 9 0.57 3028 750.00 800 20 8 4 3 18 4.00 3131 1035.00 1125 22 8 4 2 16 2.22 5158 1355.00 1425 30 10 5 2 30 0.53 5702 445.00 450 10 5 3 1 43 0.30 2054 765.00 785 22 8 3 3 18 0.38 4127 432.50 450 16 7 3 1 50 0.65 1445 1170.00 1190 25 8 4 2 2 1.61 2087 527.50 580 20 8 4 1 13 0.22 2818 875.00 900 22 8 4 2 15 2.06 3917 825.00 850 17 8 4 2 33 0.46 2220 830.00 850 23 9 4 2 37 0.27 3498 680.00 700 19 7 3 1 22 0.63 3607 740.00 800 17 7 3 2 13 0.36 3648 755.00 765 19 8 4 2 24 0.34 3561 900.00 950 24 9 4 2 10 1.55 4681 1465.00 1525 26 8 4 3 6 0.46 7088 835.00 850 20 9 4 2 46 0.46 3482 950.00 965 22 9 5 2 37 0.48 3920 920.00 950 21 9 5 2 27 1.30 4162 785.00 825 20 8 4 2 7 0.30 3785 550.00 575 16…
- 4. The following contingency table represents motor vehicle use in North America by country and vehicle type in 2016. Country Vehicle Type United States C1 Canada C2 Mexico C3 Total Automobiles V1 112,961 22,410 11,239 146,610 Buses V2 976 91 303 1,370 Motorcycles V3 8,680 716 2,053 11,449 Trucks V4 146,182 1,053 6,201 153,436 Total 268,799 24,270 19,796 312,865 g. Create a Joint Probability Table: ALL PROBABILITIES to 4 decimal places. Country Vehicle Type United States C1 Canada C2 Mexico C3 Total Automobiles V1 Buses V2 Motorcycles V3 Trucks V4 Total h. In words, what is event C1? i. In words, what is event V4? j. In words, what is event C1 ∩∩ V4 ? k. Find P(C1) l. Find P(V4) m. Find P(C1 ∩∩ V4) n. Find P(C1 ∪∪ V4) o. Find P(C1|V4) p. Find P(V4|C1)4. The following contingency table represents motor vehicle use in North America by country and vehicle type in 2016. Country Vehicle Type United States C1 Canada C2 Mexico C3 Total Automobiles V1 112,961 22,410 11,239 146,610 Buses V2 976 91 303 1,370 Motorcycles V3 8,680 716 2,053 11,449 Trucks V4 146,182 1,053 6,201 153,436 Total 268,799 24,270 19,796 312,865 a. How many vehicles are in Canada? b. How many vehicles are motorcycles? c. How many vehicles are Canadian motorcycles? d. How many vehicles are either Canadian OR motorcycles? e. How many automobiles are Mexican? f. How many vehicles are NOT automobiles? g. Create a Joint Probability Table: ALL PROBABILITIES to 4 decimal places. Country Vehicle Type United States C1 Canada C2 Mexico C3 Total Automobiles V1 Buses V2 Motorcycles V3 Trucks V4 Total h. In words, what is event C1? i. In words, what is event V4? j. In words, what is…A company that sells digital devices has its stores in several cities in Albania. The Marketing Manager plans to transmite an advertisement for the digital camera product on local television and watch sales of that product, to see the link that exists with the number of ads transmitted and product sales. After two days, the results were presented in the following table: City Trasmitted Sales(in 000 Euro) Durrës 4 15 Sarandë 2 8 Fier 5 21 Berat 6 24 Lezhë 3 17 S S = 1.58 S = 6.1 a) What is the dependent variable?b) Construct the scatterdiagram of this connection.c) Calculate the coefficient of variation and the coefficient of determination.d) Interpret the relationship between two variables.e) What is the equation that connects these two variables? Explain the values for a and b.f) What is the expected level of sales if 10 ads are trasmitted


