Use the frequency histogram to estimate the least and greatest frequency. O A. least: 23, greatest: 295 Figure 1. Salary (in thousands of Dollars) Frequency Histogram 300- O B. least: 15, greatest: 250 O C. least 50, greatest: 100 O D. least 32, greatest: 62 200- 100- 42 47 52 57 62
Use the frequency histogram to estimate the least and greatest frequency. O A. least: 23, greatest: 295 Figure 1. Salary (in thousands of Dollars) Frequency Histogram 300- O B. least: 15, greatest: 250 O C. least 50, greatest: 100 O D. least 32, greatest: 62 200- 100- 42 47 52 57 62

Glencoe Algebra 1, Student Edition, 9780079039897, 0079039898, 2018
18th Edition
ISBN:9780079039897
Author:Carter
Publisher:Carter
Chapter10: Statistics
Section10.6: Summarizing Categorical Data
Problem 4CGP

Related questions
Question
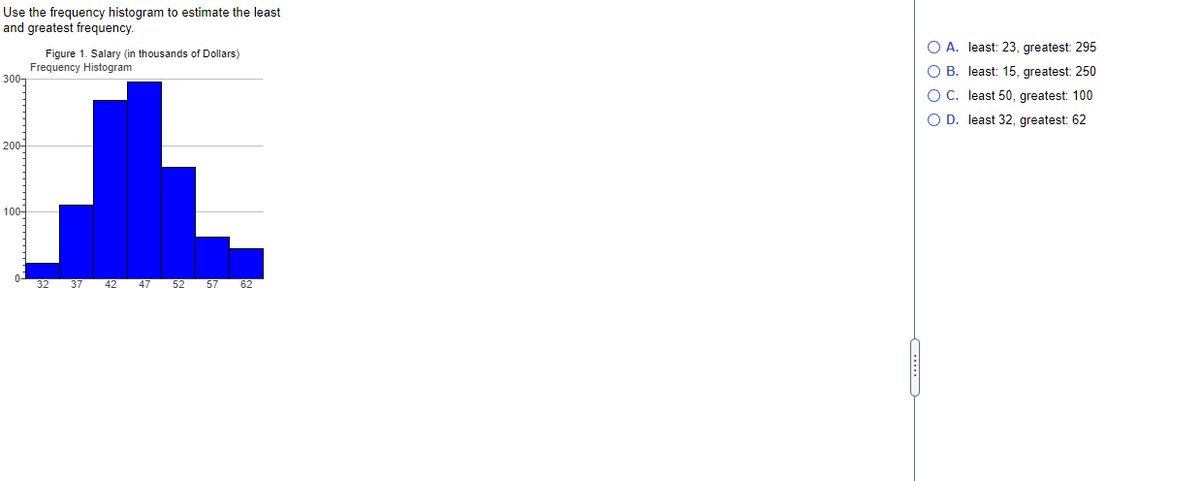
Transcribed Image Text:Use the frequency histogram to estimate the least
and greatest frequency.
O A. least: 23, greatest: 295
Figure 1. Salary (in thousands of Dollars)
Frequency Histogram
300-
O B. least: 15, greatest: 250
O C. least 50, greatest: 100
O D. least 32, greatest: 62
200-
100-
32
37
42
47 52
57
62
....
Expert Solution
This question has been solved!
Explore an expertly crafted, step-by-step solution for a thorough understanding of key concepts.

Step by step
Solved in 2 steps with 2 images

Recommended textbooks for you
Glencoe Algebra 1, Student Edition, 9780079039897…
Algebra
ISBN:
9780079039897
Author:
Carter
Publisher:
McGraw Hill

Holt Mcdougal Larson Pre-algebra: Student Edition…
Algebra
ISBN:
9780547587776
Author:
HOLT MCDOUGAL
Publisher:
HOLT MCDOUGAL
Glencoe Algebra 1, Student Edition, 9780079039897…
Algebra
ISBN:
9780079039897
Author:
Carter
Publisher:
McGraw Hill
Holt Mcdougal Larson Pre-algebra: Student Edition…
Algebra
ISBN:
9780547587776
Author:
HOLT MCDOUGAL
Publisher:
HOLT MCDOUGAL