Use the given data to find the best predicted value of the response variable. Six pairs of data yield r = 0.789 and the regression equation y = 4x – 2. Also, y= 19.0. What is the best predicted value of y for x = 5? O 18.0 19.0 O 18.5 O 22.0
Use the given data to find the best predicted value of the response variable. Six pairs of data yield r = 0.789 and the regression equation y = 4x – 2. Also, y= 19.0. What is the best predicted value of y for x = 5? O 18.0 19.0 O 18.5 O 22.0

Glencoe Algebra 1, Student Edition, 9780079039897, 0079039898, 2018
18th Edition
ISBN:9780079039897
Author:Carter
Publisher:Carter
Chapter4: Equations Of Linear Functions
Section4.6: Regression And Median-fit Lines
Problem 4PPS

Related questions
Question
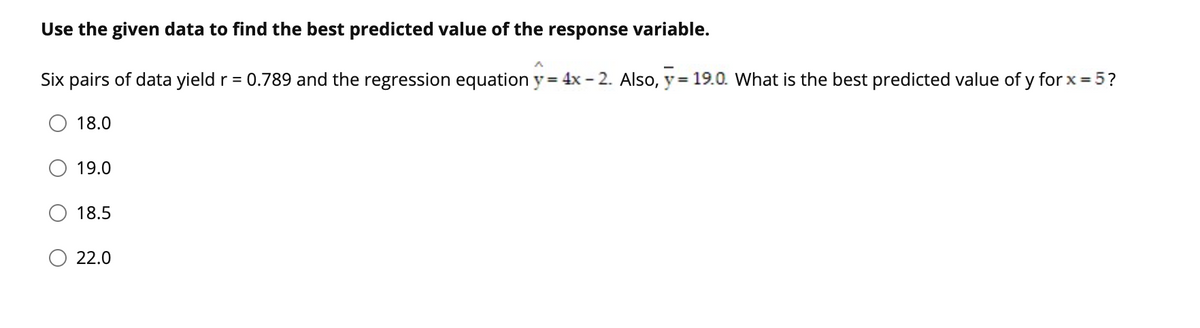
Transcribed Image Text:Use the given data to find the best predicted value of the response variable.
Six pairs of data yield r = 0.789 and the regression equation y = 4x - 2. Also, y= 19.0. What is the best predicted value of y for x = 5?
18.0
19.0
18.5
22.0
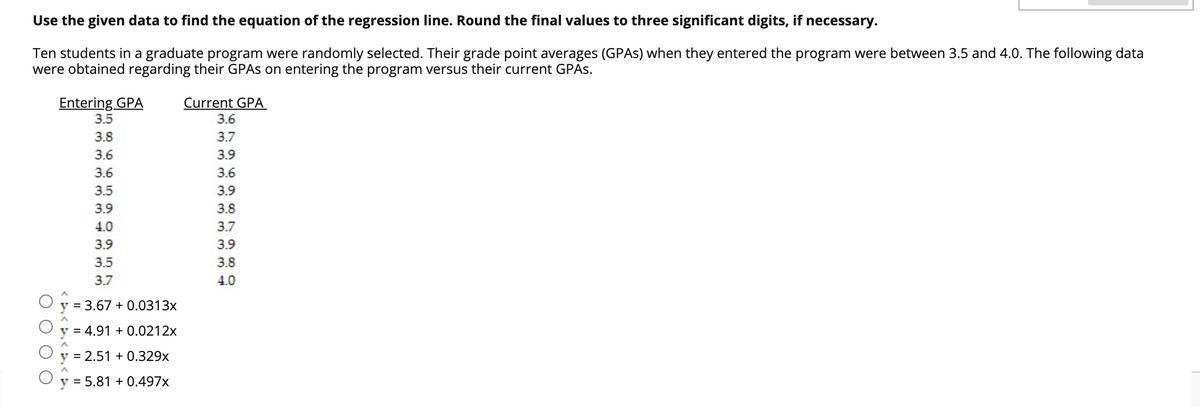
Transcribed Image Text:Use the given data to find the equation of the regression line. Round the final values to three significant digits, if necessary.
Ten students in a graduate program were randomly selected. Their grade point averages (GPAS) when they entered the program were between 3.5 and 4.0. The following data
were obtained regarding their GPAS on entering the program versus their current GPAS.
Entering GPA
Current GPA
3.5
3.6
3.8
3.7
3.6
3.9
3.6
3.6
3.5
3.9
3.9
3.8
4.0
3.7
3.9
3.5
3.8
3.7
4.0
y = 3.67 + 0.0313x
y = 4.91 + 0.0212x
y = 2.51 + 0.329x
y = 5.81 + 0.497x
Expert Solution
This question has been solved!
Explore an expertly crafted, step-by-step solution for a thorough understanding of key concepts.

This is a popular solution!

Trending now
This is a popular solution!

Step by step
Solved in 4 steps with 2 images

Recommended textbooks for you
Glencoe Algebra 1, Student Edition, 9780079039897…
Algebra
ISBN:
9780079039897
Author:
Carter
Publisher:
McGraw Hill

Functions and Change: A Modeling Approach to Coll…
Algebra
ISBN:
9781337111348
Author:
Bruce Crauder, Benny Evans, Alan Noell
Publisher:
Cengage Learning

Glencoe Algebra 1, Student Edition, 9780079039897…
Algebra
ISBN:
9780079039897
Author:
Carter
Publisher:
McGraw Hill
Functions and Change: A Modeling Approach to Coll…
Algebra
ISBN:
9781337111348
Author:
Bruce Crauder, Benny Evans, Alan Noell
Publisher:
Cengage Learning

College Algebra
Algebra
ISBN:
9781305115545
Author:
James Stewart, Lothar Redlin, Saleem Watson
Publisher:
Cengage Learning

Algebra and Trigonometry (MindTap Course List)
Algebra
ISBN:
9781305071742
Author:
James Stewart, Lothar Redlin, Saleem Watson
Publisher:
Cengage Learning