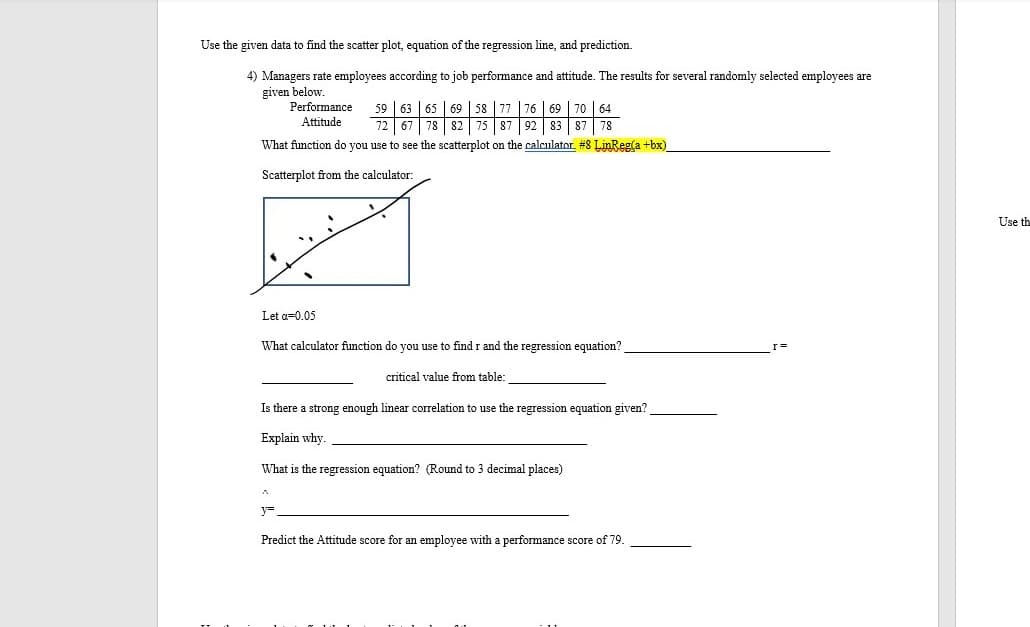
Use the given data to find the scatter plot, equation of the regression line, and prediction. 4) Managers rate employees according to job performance and attitude. The results for several randomly selected employees are given below. Performance Attitude 59 | 63 | 65 | 69 | 58 | 77 | 76 | 69 | 70 | 64 72 67 78 82 75 87 92 83 87 78 What function do you use to see the scatterplot on the calcnlator, #8 LinRegla +bx)_ Satterplot from the calculator: Let a=0.05 What calculator function do you use to find r and the regression equation?. critical value from table: Is there a strong enough linear correlation to use the regression equation given? Explain why. What is the regression equation? (Round to 3 decimal places) y= Predict the Attitude score for an employee with a performance score of 79.


Correlation
Correlation defines a relationship between two independent variables. It tells the degree to which variables move in relation to each other. When two sets of data are related to each other, there is a correlation between them.
Linear Correlation
A correlation is used to determine the relationships between numerical and categorical variables. In other words, it is an indicator of how things are connected to one another. The correlation analysis is the study of how variables are related.
Regression Analysis
Regression analysis is a statistical method in which it estimates the relationship between a dependent variable and one or more independent variable. In simple terms dependent variable is called as outcome variable and independent variable is called as predictors. Regression analysis is one of the methods to find the trends in data. The independent variable used in Regression analysis is named Predictor variable. It offers data of an associated dependent variable regarding a particular outcome.

Step by step
Solved in 3 steps with 1 images


