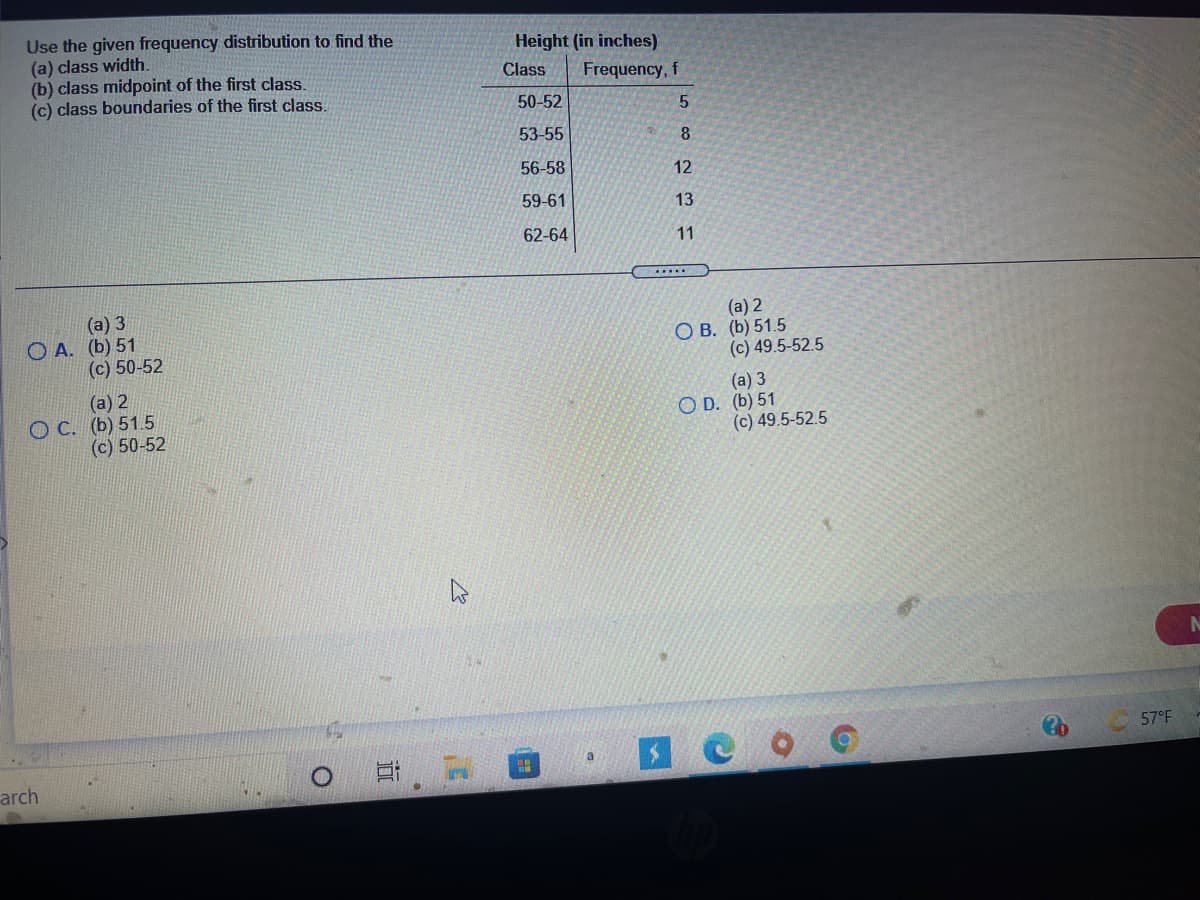
Use the given frequency distribution to find the (a) class width. (b) class midpoint of the first class. (c) class boundaries of the first class. Height (in inches) Class Frequency, f 50-52 53-55 8 56-58 12 59-61 13 62-64 11 ..... (а) 3 O A. (b) 51 (c) 50-52 (a) 2 O B. (b) 51.5 (c) 49.5-52.5 (а) 2 O C. (b) 51.5 (c) 50-52 (a) 3 O D. (b) 51 (c) 49.5-52.5 57°F a arch


Q: These data represent the record high temperatures in °F for each of the 50 states. Construct a…
A: a)If there are k=7 classes, thenWidth=Maximum value-Minimum valuek=134-1007=4.8≃5 Then, the…
Q: Construct a frequency polygon for the given frequency distribution of the pulse rates in beats per…
A: We need to construct a frequency polygon for the given frequency distribution of the pulse rates in…
Q: Use the frequency distribution shown below to construct an expanded frequency distribution. High…
A: Given data is Class 15-25 26-36 37-47 48-58 59-69 70-80 81-91 Frequency,f 18 45 66 67 80 66 23
Q: c. Organize the data into a relative frequency table. Use the following intervals: 119.5 - 124.5,…
A: Solution-: We find relative frequency histogram:
Q: The take-home salary (in kwacha) of 30 unskilled workers from a company for a particular month was…
A:
Q: Find the approximate mean for the grouped frequency distribution. Use the class midpoint to…
A:
Q: Construct the corresponding relative frequency distribution for the given frequency distribution. (…
A:
Q: In a frequency distribution, the class marks of the class intervals are 10,15,20,25, and 30…
A: Class marks are the mid-value of each class interval. class mark=upper limit+lower limit2
Q: Using the 2* rule, determine the number of class intervals(k) for the frequency distribution…
A:
Q: Construct a frequency distribution and a frequency histogram for the data set using the indicated…
A: Given Number of classes: 8 Data set: Finishing times (in seconds) of 20 male participants in a 5K…
Q: The fill volume of The following data represent the yield on 90 consecutive batches for…
A: Given :…
Q: For grouped frequency distributions, the of a class is obtained by adding the lower and upper limits…
A: Given that Grouped frequency distributions. We know that Mid point = Upper class limit + Lower…
Q: Construct a frequency distribution and a frequency histogram for the data set using the indicated…
A: The given data set is: 1717 1826 1445 2085 1955 1470 1819 1593 1632…
Q: Use the given frequency distribution to find the (a) class width. (b) class midpoints. (c) class…
A: (a) Obtain the value of the class width. The value of the class width is obtained below as follows:…
Q: The accompanying data set lists the numbers of children of world leaders. Use the data to construct…
A: s. Use the data to construct a frequency distribution using six classes and to create a frequency…
Q: Construct A Frequency Distribution – complete the Frequency Table below. Rel. f. (f/N) Real Limits f…
A: We have to find out missing value of the table like.. Real class limit Total no of frequency…
Q: Use the frequency distribution shown below to construct an expanded frequency distribution. High…
A: From the provided information, The table is as follow: Class Frequency (f) 20-30 18…
Q: Use the given frequency distribution to find the (a) class width. (b) class midpoint of the first…
A:
Q: Use the appropriate grouping method to : a. determine a frequency distribution. b. obtain a…
A: Since we only answer up to 3 sub-parts, we’ll answer the first 3. Please resubmit the question and…
Q: Determine whether the statement is true or false. If it is false, rewrite it as a true statement. In…
A:
Q: Construct the frequency distribution, using a class interval of 4.00. Also make the frequency…
A: Given: The frequency distribution, using a class interval of 4.00 is given by: Frequencies are the…
Q: Refer to the incomplete grouped frequency distribution below. Classes (Rand) Frequency | Cumulative…
A: Formal : Midpoint : (upper boundary + lower boundary)/2
Q: Construct a frequency table. Consider the scores of 50 Grade 12 students in Physics exam.…
A: Introduction - Cumulative frequency - Less than cumulative frequency is obtained by adding…
Q: Use the given frequency distribution to find the (a) class width. (b) class midpoints. (c) class…
A:
Q: (e) Determine the z-score of the second lowest and the second highest grades among the population.…
A: Given data, Data 23 60 79 32 57 74 52 70 82 36 80 77 81 95 41 65…
Q: lete the frequecy distribution table and find the meas Class Interval FrequencyClass Mark 3 fx 35-39…
A: Given: class interval Frequency 35-39 3 30-34 5 25-29 8 20-24 18 15-19 13 10-14 10…
Q: When constructing frequency distributions there must be 12 class intervals. a. False O b. True
A: Given a statement we have to write the statement true or false.
Q: Use the given frequency distribution to find the (a) class width. (b) class midpoint of the first…
A:
Q: Use the given frequency distribution to find the (a) class width (b) class midpoints (c) class…
A: The table shows the frequency distribution of temperature with their corresponding frequencies.…
Q: Use the frequency distribution shown below to construct an expanded frequency distribution. High…
A: Given frequency distribution table; To complete the given frequency distribution table.
Q: The accompanying table shows the tax, in dollars, on a pack of cigarettes in 30 randomly selected…
A: Hii ! Thanks for posting the question . Since your question has more than three subparts , we have…
Q: Use the given frequency distribution to find the (a) class width. (b) class midpoints. (c) class…
A: Here,we can see that we have a constant class width for all the classes.The class width =Upper class…
Q: Use the given frequency distribution to find t (a) dass width. (b) class midpoint of the first…
A: In grouped data, observations are clustered into groups. The groups and the corresponding…
Q: Construct a frequency distribution for the given da which has the least frequency? Amount (in…
A: Given: Find the class, frequency, relative frequency and cumulative frequency for given data.
Q: Use the given frequency distribution to find the (a) class width. (b) class midpoint of the first…
A: To create grouped frequency distribution table, we proceed as follows: 1.To find the class width,…
Q: Refer to the grouped frequency distribution shown at right. Class Limits Frequency f Is it possible…
A: The grouped frequency distribution table is given.
Q: Use the frequency distribution shown below to construct an expanded frequency distribution. High…
A:
Q: Use the given frequency distribution to find the (a) class width. (b) class midpoint of the first…
A: Given data : Class interval Frequency class boundaries 135 - 139 6 134.5 - 139.5 140 - 144 4…
Q: The accompanying data set lists the numbers of children of world leaders. Use the data to construct…
A: Arrange the all data in ascending order Minimum=0 Maximum=17 Class width = ( 17-0) / no. Of classes…
Q: Data below are total home game playing times (hours) for all Major League Baseball teams in a recent…
A: Frequency is the number of times an event is happen . To construct frequency distribution , follow…
Q: Twenty body temperature (°F) listed below. 97.1 97.2 97.5 97.6 97.6 97.8 98.0 98.0 98.2 98.2 98.2…
A: From the given information, Sample data can be given below:…
Q: Use the given frequency distribution to find the (a) class width. (b) class midpoints. (c) class…
A: Introduction: The class width, class midpoints, and class boundaries must be calculated.
Q: Use the frequency distribution shown below to construct an expanded frequency distribution. High…
A:
Q: Construct the frequency distribution, using a class interval of 5.00. Also make the class…
A: Class boundaries: The gap size between classes is the difference between the upper class limit of…
Q: Given the table below Distribution A 1-3 4 - 6 7-9 The midpoint of the class intervals of…
A:
Q: Construct a frequency distribution and determine the following. a. Range e. Relative Frequencies b.…
A: Data is given, We have to construct frequency distribution We have to calculate, range, interval...…
Q: Question content area bottom Part 1 (a) What is the class width? enter your response here…
A:
Q: Complete the frequency distribution table below. Use the minimum data entry as the lower limit of…
A:
Q: Using the frequency distribution below, find the (a) class width (b) boundary of first class. Class…
A: Given frequency table


Trending now
This is a popular solution!

Step by step
Solved in 2 steps with 2 images

- Given the following frequency table, calculate the mean of X. (Please round your answer to 2 decimal places, ex: 3.12) +-----------------------------------+ | X: 16 17 18 19 20 | |-----------------------------------| | f(X): 2 5 4 3 1 | +-----------------------------------+Use the central limit theorem to find the mean and standard error of the mean of the indicated sampling distribution. Then sketch a graph of the sampling distribution. The per capita consumption of red meat by people in a country in a recent year was normally distributed, with a mean of 100 pounds and a standard deviation of 38.5 pounds. Random samples of size 18 are drawn from this population and the mean of each sample is determined. μx=nothingThe temperature in oF in Yosemite National Park, California in random 20 days were recorded in the following stem-and-leaf plot. Stem (in tens) Leaf (in ones) 5 2445 6 34668 7 00224456 8 112 Construct a frequency distribution with a class width of 8 starting with a lower class limit of 50. Duration Frequency - - - - -
- Use the central limit theorem to find the mean and standard error of the mean of the indicated sampling distribution. Then sketch a graph of the sampling distribution. The per capita consumption of red meat by people in a country in a recent year was normally distributed, with a mean of 100 pounds and a standard deviation of 38.6 pounds. Random samples of size 20 are drawn from this population and the mean of each sample is determined. ux= o-x= graph=The inner diameters of washers produced by a company can be measured to the nearest thousandth of an inch. If the class marks of a frequency distribution of these diameters are given in inches by 0.587, 0.602 and 0.617, and the class limits of these class marks areUse the central limit theorem to find the mean and standard error of the mean of the indicated sampling distribution. Then sketch a graph of the sampling distribution. The per capita consumption of red meat by people in a country in a recent year was normally distributed, with a mean of 109 pounds and a standard deviation of 38.3 pounds. Random samples of size 15 are drawn from this population and the mean of each sample is determined. μx=nothing σx=nothing (Round to three decimal places as needed.) Sketch a graph of the sampling distribution. Choose the correct graph below. A. 109 89.2128.8 x A normal curve is over a horizontal x overbar axis labeled from 89.2 to 128.8 and is centered on 109. B. 9.9 -99.1118.9 x A normal curve is over a horizontal x overbar axis labeled from negative 99.1 to 118.9 and is centered on 9.9. C. 9.9 -317.1336.9 x A normal…
- Which of the following are specified by the central limit theorem? a. the mean of a specific sample from the distribution of sample means b. the mean of the distribution of sample means c. the shape of the distribution of sample means d. the variability for the distribution of sample meansThe inner diameters of washers produced by a company can be measured to the nearest thousandth of an inch. If the class marks of a frequency distribution of these diameters are given in inches by 0.587, 0.602 and 0.617, and the class limits of these class marks are Blank 1, Blank 2 and Blank 3 (use 3 decimal places)) Suppose a man has ordered twelve 1-gallon paint cans of a particular color (lilac) from the local paint store in order to paint his mother’s house. Unknown to the man, three of these can contains an incorrect mix of paint. For this weekend’s big project, the man randomly selects four of these 1-gallon cans to paint his mother’s living room. Let x = the number of the paint cans selected that are defective. Unknown to the man, x follows a hypergeometric distribution. Find the probability that none of the four cans selected contains an incorrect mix of paint. A) 01818 B) 50909 C) 25455 D) 0.21818
- ) Suppose a man has ordered twelve 1-gallon paint cans of a particular color (lilac) from the local paint store in order to paint his mother’s house. Unknown to the man, three of these can contains an incorrect mix of paint. For this weekend’s big project, the man randomly selects four of these 1-gallon cans to paint his mother’s living room. Let x = the number of the paint cans selected that are defective. Unknown to the man, x follows a hypergeometric distribution. Find the probability that a least one of the four can selected contains an incorrect mix of paint. A) 78182 B) 74545 C) 50909 D) 49091In the world populations, normal body temperature follows a normal distribution with mean = 98.6 degrees F and a standard deviation of 0.6. The mean body temperature will be determined for a randomly selected group of 14 individuals. Is Central Limit Theorem can be applied here, Blank 1Using the frequency distribution, describe the shape in terms of its skewness and kurtosis (calculate/compute SK and K).