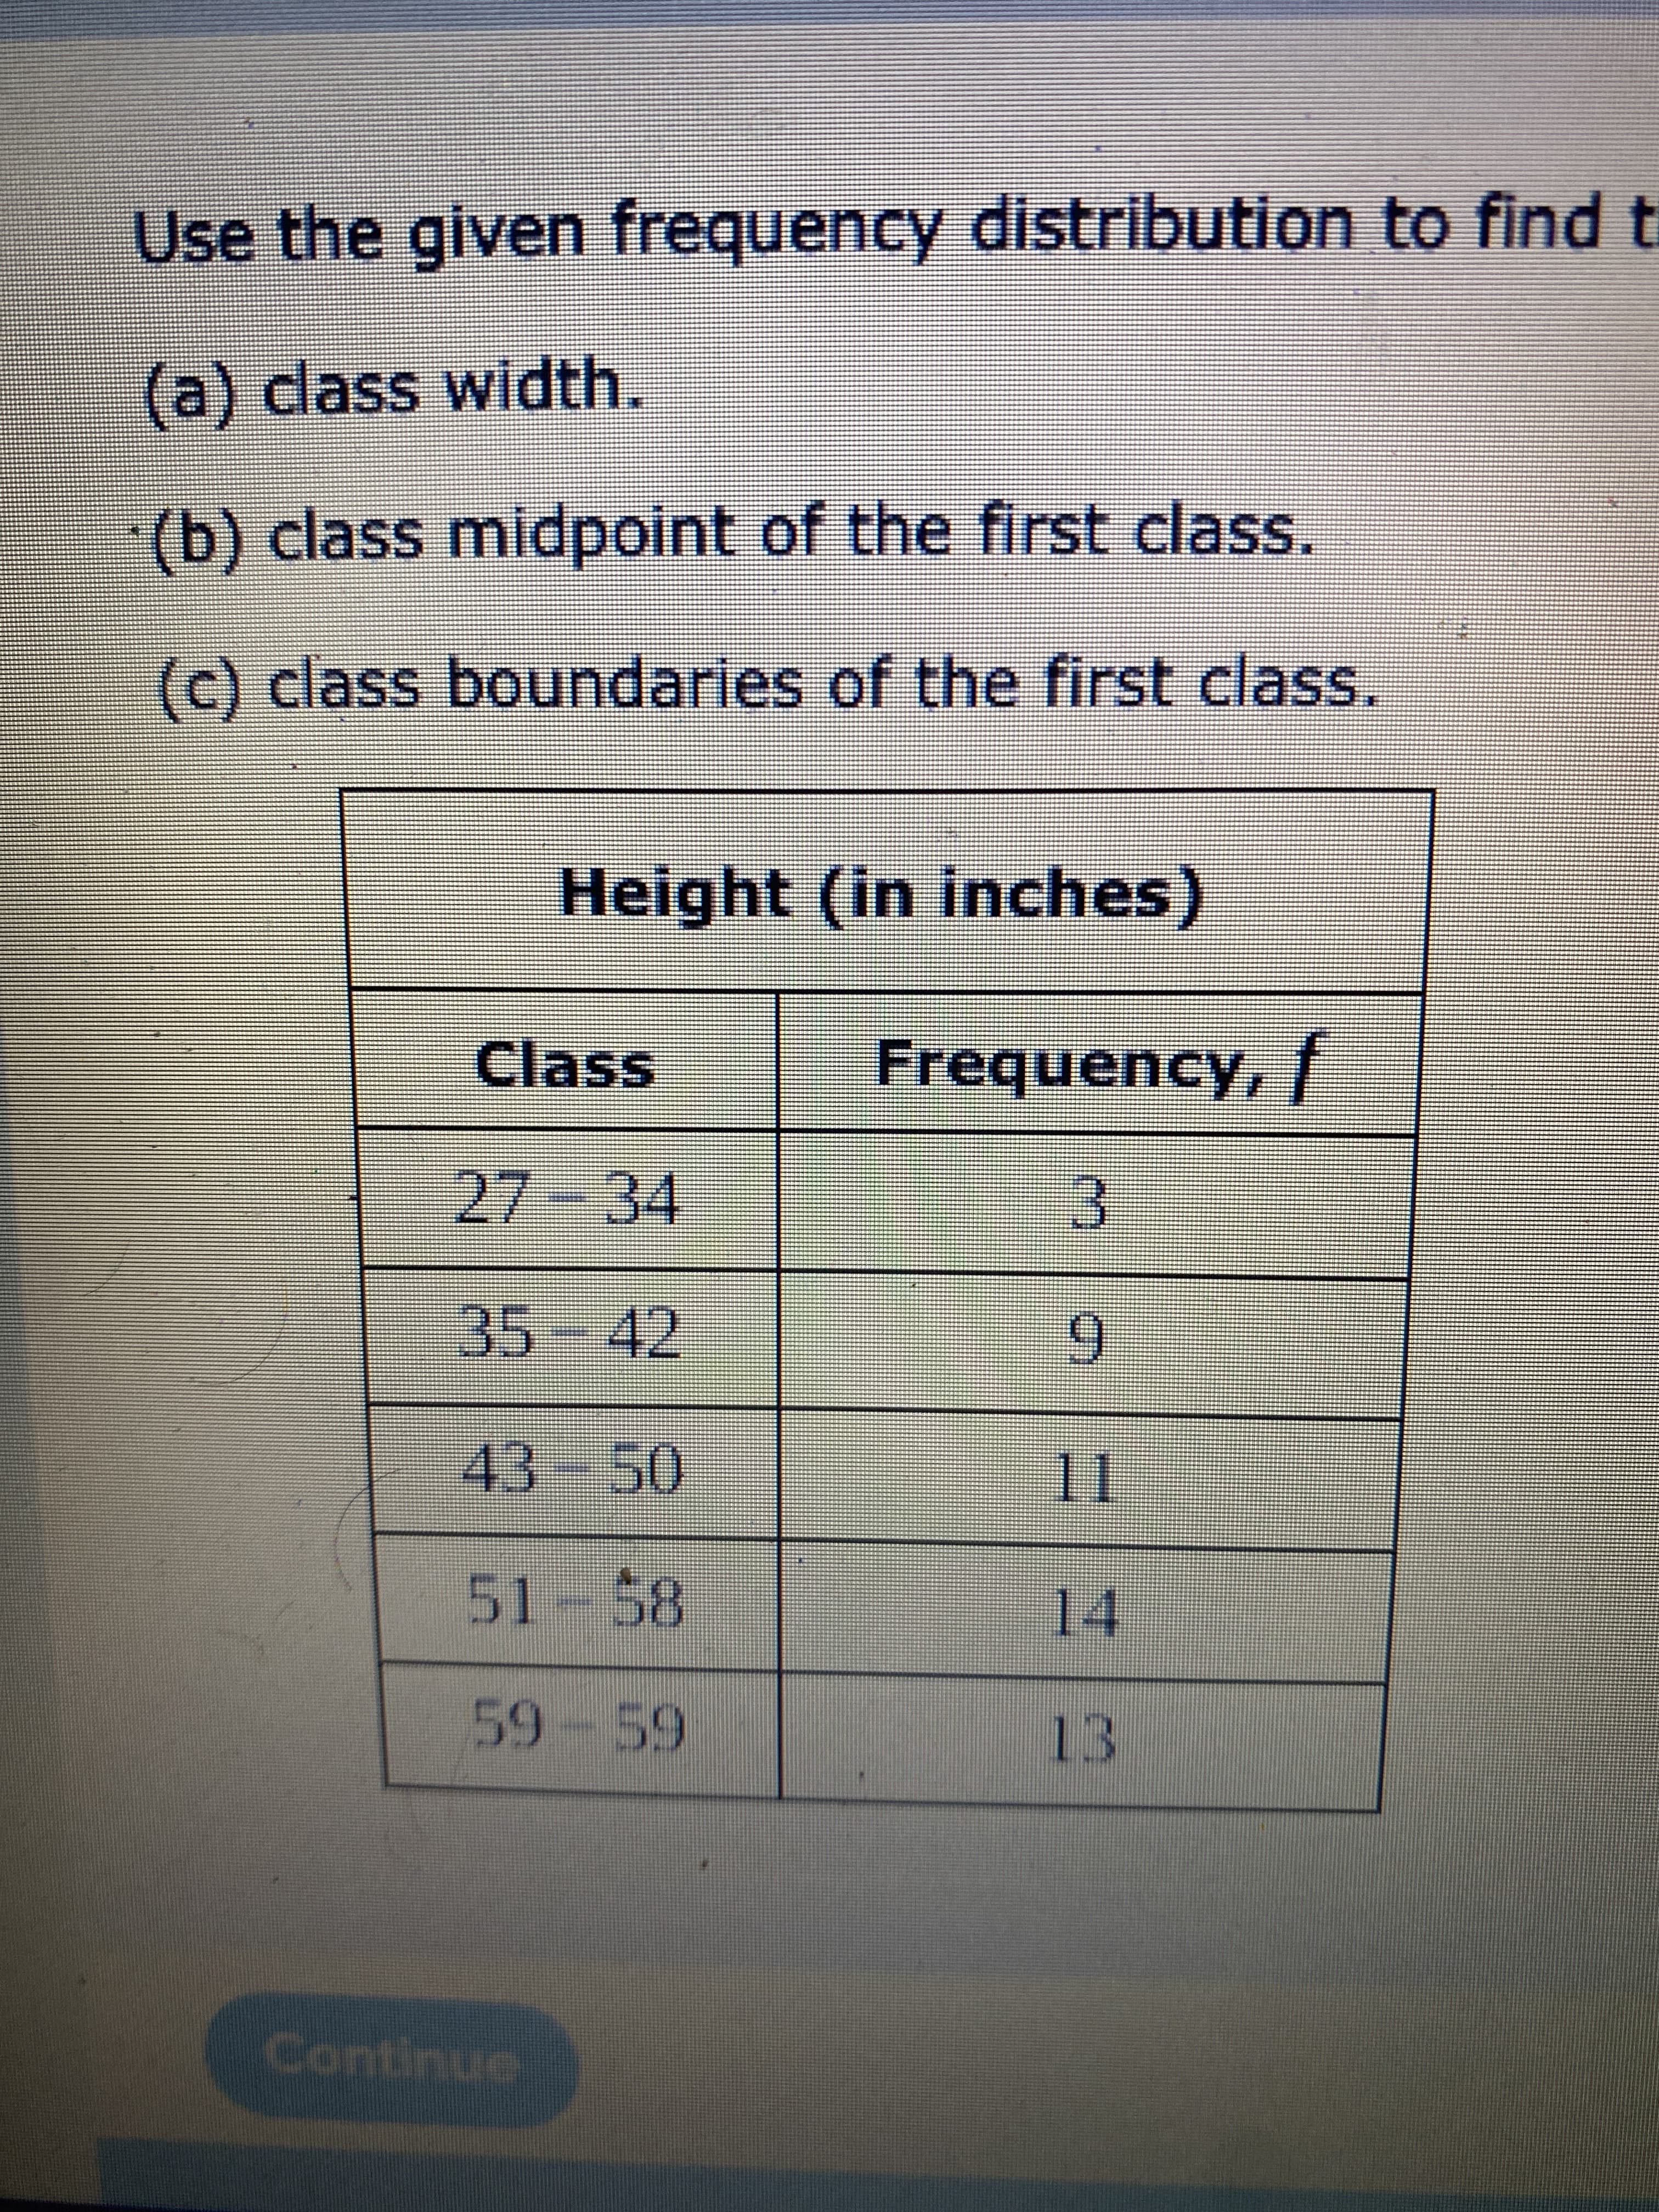
Use the given frequency distribution to find t (a) dass width. (b) class midpoint of the first class. (c) class boundaries of the first class. Height (in inches) Class FrequencY, T 27-34 3. 35 -42 9. 43-50 51-58 14 59-59 13 Continue


Q: Use the frequency distribution shown below to construct an expanded frequency distributie High…
A: Given Data, Class Frequency 18-28 18 29-39 45 40-50 68 51-61 69 62-72 75 73-83 68…
Q: Construct a frequency polygon for the given frequency distribution of the pulse rates in beats per…
A: We need to construct a frequency polygon for the given frequency distribution of the pulse rates in…
Q: Use the frequency distribution shown below to construct an expanded frequency distribution. High…
A: Given data is Class 15-25 26-36 37-47 48-58 59-69 70-80 81-91 Frequency,f 18 45 66 67 80 66 23
Q: Find the approximate mean for the grouped frequency distribution. Use the class midpoint to…
A:
Q: Use the frequency distribution shown below to construct an expanded frequency distribution. High…
A: Given information: The frequency distribution table: Class 17-27 28-38 39-49 50-60 61-71 72-82…
Q: Determine the second moment about the arbitrary point (A=84.5) for the frequency distribution given…
A: The moments about the arbitrary point is known as raw moments. It is calculated using based on the…
Q: Describe the distribution of this variable by commenting on the shape (modality (how many peaks),…
A: Form the given graphs1st graph is uniformly distributed2nd graph is skew distributed (right skewed…
Q: Find a class width, class midpoint and a class boundary of the third class of the given frequency…
A:
Q: Use the frequency distribution shown below to construct an expanded frequency distribution. High…
A:
Q: Glven below is the hourly wage distribution in Saudi Riyal. WAGES(S.R) Frequency 12 14 --- 15-17 18-…
A: Given : Data represents hourly wages distribution in Saudi Riyal. Solution: Class(1) Frequency…
Q: Use the given frequency distribution to find the (a) class width. (b) class midpoints. (c) class…
A: (a) Obtain the value of the class width. The value of the class width is obtained below as follows:…
Q: Use this frequency distribution table to find relative frequency distribution as a percentage…
A:
Q: Miles (per day) Use the given frequency distribution to find the (a) class width. (b) class midpoint…
A: Given Number of frequency 5
Q: The accompanying data set lists the numbers of children of world leaders. Use the data to construct…
A: s. Use the data to construct a frequency distribution using six classes and to create a frequency…
Q: Construct A Frequency Distribution – complete the Frequency Table below. Rel. f. (f/N) Real Limits f…
A: We have to find out missing value of the table like.. Real class limit Total no of frequency…
Q: Use the frequency distribution shown below to construct an expanded frequency distribution. High…
A: From the provided information, The table is as follow: Class Frequency (f) 20-30 18…
Q: Use the given frequency distribution to find the (a) class width. (b) class midpoint of the first…
A:
Q: Use the given frequency distribution table, estimate the following: Class boundaries Frequency (f)…
A:
Q: Construct a frequency table. Consider the scores of 50 Grade 12 students in Physics exam.…
A: Introduction - Cumulative frequency - Less than cumulative frequency is obtained by adding…
Q: (e) Determine the z-score of the second lowest and the second highest grades among the population.…
A: Given data, Data 23 60 79 32 57 74 52 70 82 36 80 77 81 95 41 65…
Q: Moving to another question will save this response. Question 1 Use the given frequency distribution…
A: Class width is the lower limit of second class - lower limit of the first class.
Q: Use the given frequency distribution to find the (a) class width. (b) class midpoint of the first…
A:
Q: Can you assist me in answering this question, please? I am unsure as to how I can proceed with a…
A: The provided frequency distribution is:
Q: Use the frequency distribution shown below to construct an expanded frequency distribution. High…
A: Given frequency distribution table; To complete the given frequency distribution table.
Q: The accompanying table shows the tax, in dollars, on a pack of cigarettes in 30 randomly selected…
A: Hii ! Thanks for posting the question . Since your question has more than three subparts , we have…
Q: Use the given frequency distribution to find the (a) class width. (b) class midpoints. (c) class…
A: Here,we can see that we have a constant class width for all the classes.The class width =Upper class…
Q: For the frequency distribution graph below identify the correct Skewness and Kurtosis values? Select…
A: Skewness: Skewness is a measure of symmetric which is lack of symmetry in the distribution. The long…
Q: Use the given frequency distribution to find the (a) class width. (b) class midpoint of the first…
A: Solution
Q: FILE A social scientist is studying the use of iPods by college students. A sample of 45 students…
A: Since you have posted a question with multiple sub parts, according to our guidelines we can solve…
Q: Use the given frequency distribution to find the (a) class width. (b) class midpoint of the first…
A: To create grouped frequency distribution table, we proceed as follows: 1.To find the class width,…
Q: For a frequency distribution in the (a, b, 0) class, you are given i pk = 0.0768 %3D ii Pk+1 = Pk+2…
A: The a,b,0 class is a distribution of discreet random variable N, called the counting random…
Q: The number of damaged eggs, D, in cartons of six eggs have been recorded by an inspector at a…
A: The number of boxes is 150000 therefore: 150000=141393+8396+a+ba+b=211 The value of P is given by:…
Q: Use the given frequency distribution to find the (a) class width. (b) class midpoints. (c) class…
A: a) The class width is the difference between the lower class limits of two consecutive classes or…
Q: The given data represents a frequency distribution of the F-scale intensities of recent tornadoes.…
A: The end points of the frequency polygon must touch the horizontal axis.
Q: Use the given frequency distribution to find the (a) class width. (b) class midpoint of the first…
A: Given data : Class interval Frequency class boundaries 135 - 139 6 134.5 - 139.5 140 - 144 4…
Q: Q3) Pre-cast factory which produce different lengths of beams as follows: Length of beams Freq. 3.3…
A:
Q: The data represents the daily rainfall (in inches) for one month. Construct a frequency distribution…
A: The minimum value of the data is 0 and the maximum value is 1.25. Consider the lower limit of the…
Q: Develop a frequency distribution for the variable "Yearly Salary." Start with your Bin with 40,000…
A: Frequency refers to the number of times an event or a value occurs. A frequency table is a table…
Q: Use the frequency distribution shown below to construct an expanded frequency distribution. High…
A:
Q: Construct a frequency distribution and a frequency histogram for the data set using the indicated…
A: The class width can be found by dividing the difference in highest and lowest value of data set by…
Q: The data represents the daily rainfall (in inches) for one month. Construct a frequency distribution…
A: Given that, The data represents the daily rainfall for one month.
Q: (a) Find Bowley's coefficient of skewness for the following frequency distribution:– 1 2 3 5 6 No.…
A:
Q: The accompanying data set lists the numbers of children of world leaders. Use the data to construct…
A: From the given table.
Q: The given data represents a frequency distribution of the F-scale intensities of recent tornadoes.…
A: Given that We have to draw frequency polygon and determine whether it is positively or negatively…
Q: Q1. (a) Define frequency distributions.
A: The objective is to find highest grade ,lowest grade ,range. we have given data of sample points…
Q: Use the given frequency distribution table, estimate the following: Class boundariesFrequency (f)…
A: The given question can be solved as shown in step 2.
Q: Use the given frequency distribution to find the (a) class width. (b) class midpoint of the first…
A: We have to answer question on frequency distribution of the data.
Q: Use the given frequency distribution table, estimate the following: Class boundaries Frequency…
A:
Q: Q. 32. Calculate Q, and Qs for the following frequency distribution; Class Interval Frequency c.f.…
A:

Step by step
Solved in 2 steps

- The t distribution is appropriate to use when?In the world populations, normal body temperature follows a normal distribution with mean = 98.6 degrees F and a standard deviation of 0.6. The mean body temperature will be determined for a randomly selected group of 14 individuals. Is Central Limit Theorem can be applied here, Blank 1Use the central limit theorem to find the mean and standard error of the mean of the indicated sampling distribution. Then sketch a graph of the sampling distribution. The per capita consumption of red meat by people in a country in a recent year was normally distributed, with a mean of 100 pounds and a standard deviation of 38.5 pounds. Random samples of size 18 are drawn from this population and the mean of each sample is determined. μx=nothing
- (d) Calculate the semi-interquartile range of the distribution.Use the central limit theorem to find the mean and standard error of the mean of the indicated sampling distribution. Then sketch a graph of the sampling distribution. The per capita consumption of red meat by people in a country in a recent year was normally distributed, with a mean of 109 pounds and a standard deviation of 38.3 pounds. Random samples of size 15 are drawn from this population and the mean of each sample is determined. μx=nothing σx=nothing (Round to three decimal places as needed.) Sketch a graph of the sampling distribution. Choose the correct graph below. A. 109 89.2128.8 x A normal curve is over a horizontal x overbar axis labeled from 89.2 to 128.8 and is centered on 109. B. 9.9 -99.1118.9 x A normal curve is over a horizontal x overbar axis labeled from negative 99.1 to 118.9 and is centered on 9.9. C. 9.9 -317.1336.9 x A normal…Suppose a man has ordered twelve 1-gallon paint cans of a particular color (lilac) from the local paint store in order to paint his mother’s house. Unknown to the man, three of these can contains an incorrect mix of paint. For this weekend’s big project, the man randomly selects four of these 1-gallon cans to paint his mother’s living room. Let x = the number of the paint cans selected that are defective. Unknown to the man, x follows a hypergeometric distribution. Find the mean of this distribution. A) 12 B) 3 C) 1 D) 4
- The amount of time a service technician needs to change the oil in a car is uniformly distributed between 11 and 21 minutes. Let X = the time needed to change the oil on a car. b. Graph the distribution and find P (x > 19). Round to the nearest tenth.The temperature in oF in Yosemite National Park, California in random 20 days were recorded in the following stem-and-leaf plot. Stem (in tens) Leaf (in ones) 5 2445 6 34668 7 00224456 8 112 Construct a frequency distribution with a class width of 8 starting with a lower class limit of 50. Duration Frequency - - - - -The inner diameters of washers produced by a company can be measured to the nearest thousandth of an inch. If the class marks of a frequency distribution of these diameters are given in inches by 0.587, 0.602 and 0.617, and the class limits of these class marks are Blank 1, Blank 2 and Blank 3 (use 3 decimal places)
- Plot an F-distribution (in Excel) with an area of 0.10 at the right tail, with the degree of freedom for the numerator is 20 and the degree of freedom of the denominator is 16.Use the central limit theorem to find the mean and standard error of the mean of the indicated sampling distribution. Then sketch a graph of the sampling distribution. The per capita consumption of red meat by people in a country in a recent year was normally distributed, with a mean of 114 pounds and a standard deviation of 39.2 pounds. Random samples of size 19 are drawn from this population and the mean of each sample is determined. μx=enter your response here σx=enter your response here (Round to three decimal places as needed.) Sketch a graph of the sampling distribution. Choose the correct graph below. A. 9.0 -105.0123.0 x A normal curve is over a horizontal x overbar axis labeled from negative 105.0 to 123.0 and is centered on 9.0. B. 114 87.0141.0 x A normal curve is over a horizontal x overbar axis labeled from 87.0 to 141.0 and is centered on 114. C.…Solve its from frequency distribution

