Use the given frequency distribution to find the (a) class width. (b) class midpoint of the first class. (c) class boundaries of the first class. Height (in inches) Class Frequency, f 28-31 4 32- 35 8 36 - 39 14 40- 43 12 44 44 13
Use the given frequency distribution to find the (a) class width. (b) class midpoint of the first class. (c) class boundaries of the first class. Height (in inches) Class Frequency, f 28-31 4 32- 35 8 36 - 39 14 40- 43 12 44 44 13

Chapter5: Exponential And Logarithmic Functions
Section5.5: Exponential And Logarithmic Models
Problem 4ECP

Related questions
Question
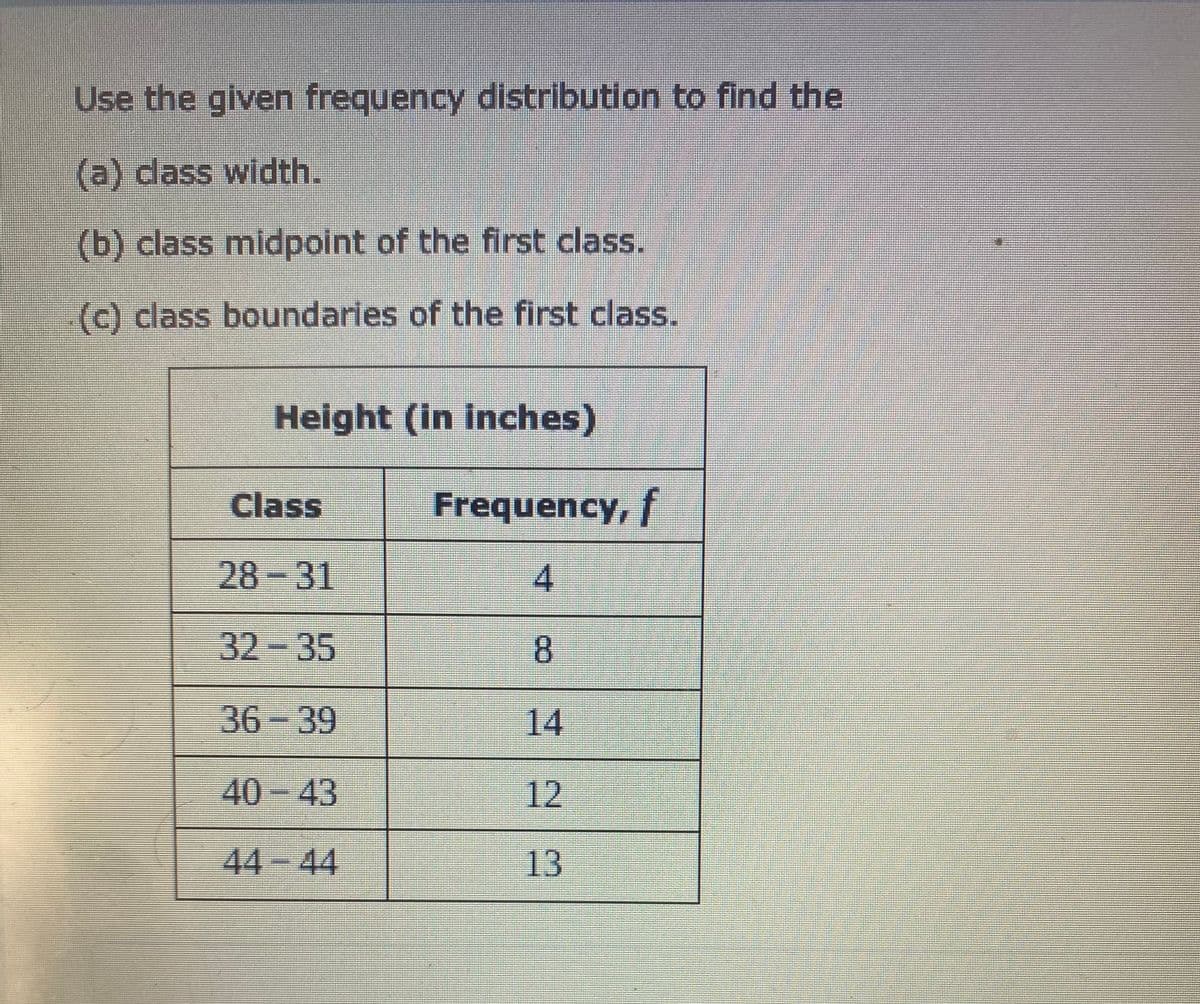
Transcribed Image Text:Use the given frequency distribution to find the
(a) dass width.
(b) class midpoint of the first class.
(c) class boundaries of the first class.
Height (in inches)
Class
Frequency,t
28-31
32-35
8.
36-39
14
40-43
12
44-44
13
Expert Solution
This question has been solved!
Explore an expertly crafted, step-by-step solution for a thorough understanding of key concepts.

Step by step
Solved in 2 steps with 1 images

Recommended textbooks for you

Big Ideas Math A Bridge To Success Algebra 1: Stu…
Algebra
ISBN:
9781680331141
Author:
HOUGHTON MIFFLIN HARCOURT
Publisher:
Houghton Mifflin Harcourt

Trigonometry (MindTap Course List)
Trigonometry
ISBN:
9781337278461
Author:
Ron Larson
Publisher:
Cengage Learning
Big Ideas Math A Bridge To Success Algebra 1: Stu…
Algebra
ISBN:
9781680331141
Author:
HOUGHTON MIFFLIN HARCOURT
Publisher:
Houghton Mifflin Harcourt
Trigonometry (MindTap Course List)
Trigonometry
ISBN:
9781337278461
Author:
Ron Larson
Publisher:
Cengage Learning

Glencoe Algebra 1, Student Edition, 9780079039897…
Algebra
ISBN:
9780079039897
Author:
Carter
Publisher:
McGraw Hill