Use the Hypothesis Testing flow chart interactive to answer the following question. Given the claim that "at least 60% of adults vote," which of the following is the symbolic form of the null hypothesis Ho? Choose the correct answer below. О А. р<0.60 О В. Р3D0.60 О С. р20.60 D. ps0.60
Use the Hypothesis Testing flow chart interactive to answer the following question. Given the claim that "at least 60% of adults vote," which of the following is the symbolic form of the null hypothesis Ho? Choose the correct answer below. О А. р<0.60 О В. Р3D0.60 О С. р20.60 D. ps0.60

MATLAB: An Introduction with Applications
6th Edition
ISBN:9781119256830
Author:Amos Gilat
Publisher:Amos Gilat
Chapter1: Starting With Matlab
Section: Chapter Questions
Problem 1P

Related questions
Question
5.
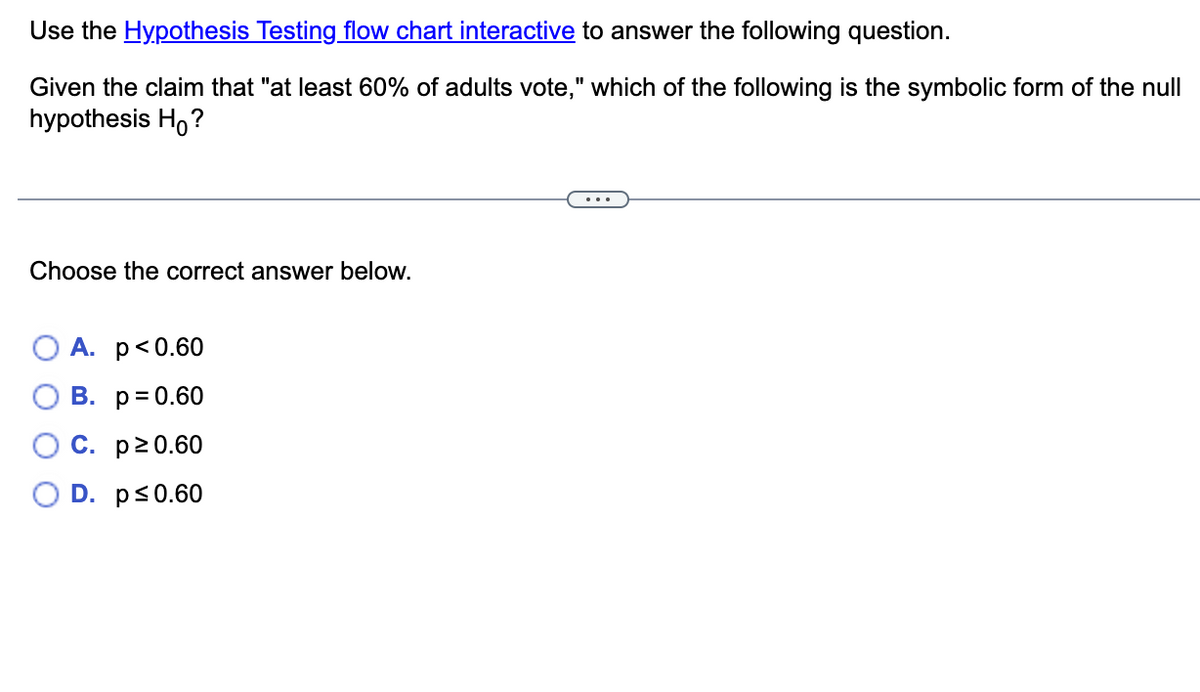
Transcribed Image Text:Use the Hypothesis Testing flow chart interactive to answer the following question.
Given the claim that "at least 60% of adults vote," which of the following is the symbolic form of the null
hypothesis H,?
...
Choose the correct answer below.
О А. р<0.60
О В. р%3D0.60
ОС. р20.60
O D. ps0.60
Expert Solution
This question has been solved!
Explore an expertly crafted, step-by-step solution for a thorough understanding of key concepts.

This is a popular solution!

Trending now
This is a popular solution!

Step by step
Solved in 2 steps with 2 images

Recommended textbooks for you
MATLAB: An Introduction with Applications
Statistics
ISBN:
9781119256830
Author:
Amos Gilat
Publisher:
John Wiley & Sons Inc

Probability and Statistics for Engineering and th…
Statistics
ISBN:
9781305251809
Author:
Jay L. Devore
Publisher:
Cengage Learning

Statistics for The Behavioral Sciences (MindTap C…
Statistics
ISBN:
9781305504912
Author:
Frederick J Gravetter, Larry B. Wallnau
Publisher:
Cengage Learning
MATLAB: An Introduction with Applications
Statistics
ISBN:
9781119256830
Author:
Amos Gilat
Publisher:
John Wiley & Sons Inc
Probability and Statistics for Engineering and th…
Statistics
ISBN:
9781305251809
Author:
Jay L. Devore
Publisher:
Cengage Learning
Statistics for The Behavioral Sciences (MindTap C…
Statistics
ISBN:
9781305504912
Author:
Frederick J Gravetter, Larry B. Wallnau
Publisher:
Cengage Learning

Elementary Statistics: Picturing the World (7th E…
Statistics
ISBN:
9780134683416
Author:
Ron Larson, Betsy Farber
Publisher:
PEARSON

The Basic Practice of Statistics
Statistics
ISBN:
9781319042578
Author:
David S. Moore, William I. Notz, Michael A. Fligner
Publisher:
W. H. Freeman

Introduction to the Practice of Statistics
Statistics
ISBN:
9781319013387
Author:
David S. Moore, George P. McCabe, Bruce A. Craig
Publisher:
W. H. Freeman