Use the information in picture 1 and picture 2 to graphically show the maximum profit. Please kindly provide a picture of the graph with labels such as the profit-maximizing quantity and price, total cost, total revenue, and profit. Thank you
Use the information in picture 1 and picture 2 to graphically show the maximum profit. Please kindly provide a picture of the graph with labels such as the profit-maximizing quantity and price, total cost, total revenue, and profit. Thank you

Chapter1: Making Economics Decisions
Section: Chapter Questions
Problem 1QTC

Related questions
Question
Use the information in picture 1 and picture 2 to graphically show the maximum profit. Please kindly provide a picture of the graph with labels such as the profit-maximizing quantity and
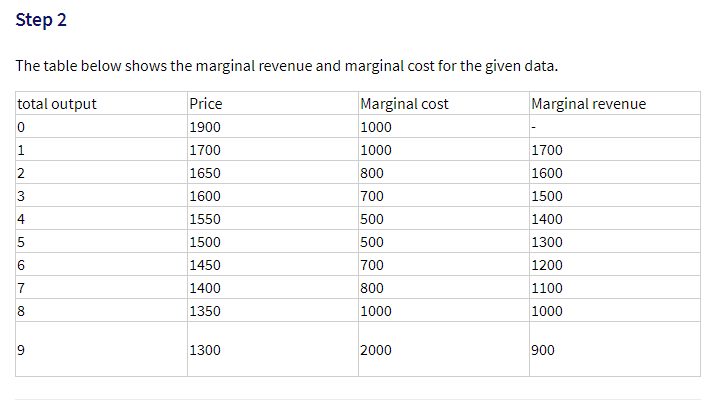
Transcribed Image Text:Step 2
The table below shows the marginal revenue and marginal cost for the given data.
total output
Price
Marginal cost
Marginal revenue
1900
1000
1
1700
1000
1700
1650
800
1600
3
1600
700
1500
1550
500
1400
1500
500
1300
1450
700
1200
7
1400
800
1100
8
1350
1000
1000
1300
2000
900
2.
す n
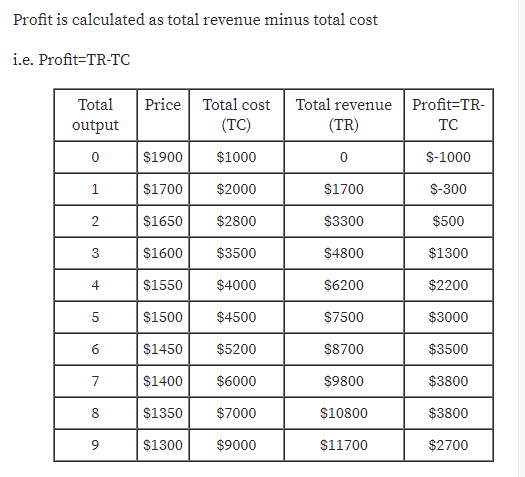
Transcribed Image Text:Profit is calculated as total revenue minus total cost
i.e. Profit=TR-TC
Price Total cost
(TC)
Total
Total revenue
Profit=TR-
output
(TR)
TC
$1900
$1000
S-1000
1
$1700
$2000
$1700
$-300
$1650
$2800
$3300
$500
$1600
$3500
$4800
$1300
4
$1550
$4000
$6200
$2200
$1500
$4500
$7500
$3000
$1450
$5200
$8700
$3500
7
$1400
$6000
$9800
$3800
$1350
$7000
$10800
$3800
$1300
$9000
$11700
$2700
6.
2.
Expert Solution
This question has been solved!
Explore an expertly crafted, step-by-step solution for a thorough understanding of key concepts.

Step by step
Solved in 3 steps with 2 images

Knowledge Booster


Learn more about
Need a deep-dive on the concept behind this application? Look no further. Learn more about this topic, economics and related others by exploring similar questions and additional content below.Recommended textbooks for you

Principles of Economics (12th Edition)
Economics
ISBN:
9780134078779
Author:
Karl E. Case, Ray C. Fair, Sharon E. Oster
Publisher:
PEARSON

Engineering Economy (17th Edition)
Economics
ISBN:
9780134870069
Author:
William G. Sullivan, Elin M. Wicks, C. Patrick Koelling
Publisher:
PEARSON
Principles of Economics (12th Edition)
Economics
ISBN:
9780134078779
Author:
Karl E. Case, Ray C. Fair, Sharon E. Oster
Publisher:
PEARSON
Engineering Economy (17th Edition)
Economics
ISBN:
9780134870069
Author:
William G. Sullivan, Elin M. Wicks, C. Patrick Koelling
Publisher:
PEARSON

Principles of Economics (MindTap Course List)
Economics
ISBN:
9781305585126
Author:
N. Gregory Mankiw
Publisher:
Cengage Learning

Managerial Economics: A Problem Solving Approach
Economics
ISBN:
9781337106665
Author:
Luke M. Froeb, Brian T. McCann, Michael R. Ward, Mike Shor
Publisher:
Cengage Learning

Managerial Economics & Business Strategy (Mcgraw-…
Economics
ISBN:
9781259290619
Author:
Michael Baye, Jeff Prince
Publisher:
McGraw-Hill Education