Use the information in Table 1 and the solution to part (a)(iv) to complete the following table, giving your values rounded to three decimal places. Number of failed O-rings 0 1 2 3 4 5 6 Observed proportion
Use the information in Table 1 and the solution to part (a)(iv) to complete the following table, giving your values rounded to three decimal places. Number of failed O-rings 0 1 2 3 4 5 6 Observed proportion

MATLAB: An Introduction with Applications
6th Edition
ISBN:9781119256830
Author:Amos Gilat
Publisher:Amos Gilat
Chapter1: Starting With Matlab
Section: Chapter Questions
Problem 1P

Related questions
Question
-
Use the information in Table 1 and the solution to part (a)(iv) to complete the following table, giving your values rounded to three decimal places.
Number of failed O-rings
0 1 2 3 4 5 6
Observed proportion
Probability
Comment briefly on how close the observed proportions of flights
on which 0, 1, 2, . . . , 6 O-ring seals failed are to those predicted by
the binomial model. What does this suggest about the
appropriateness, or otherwise, of the binomial model?
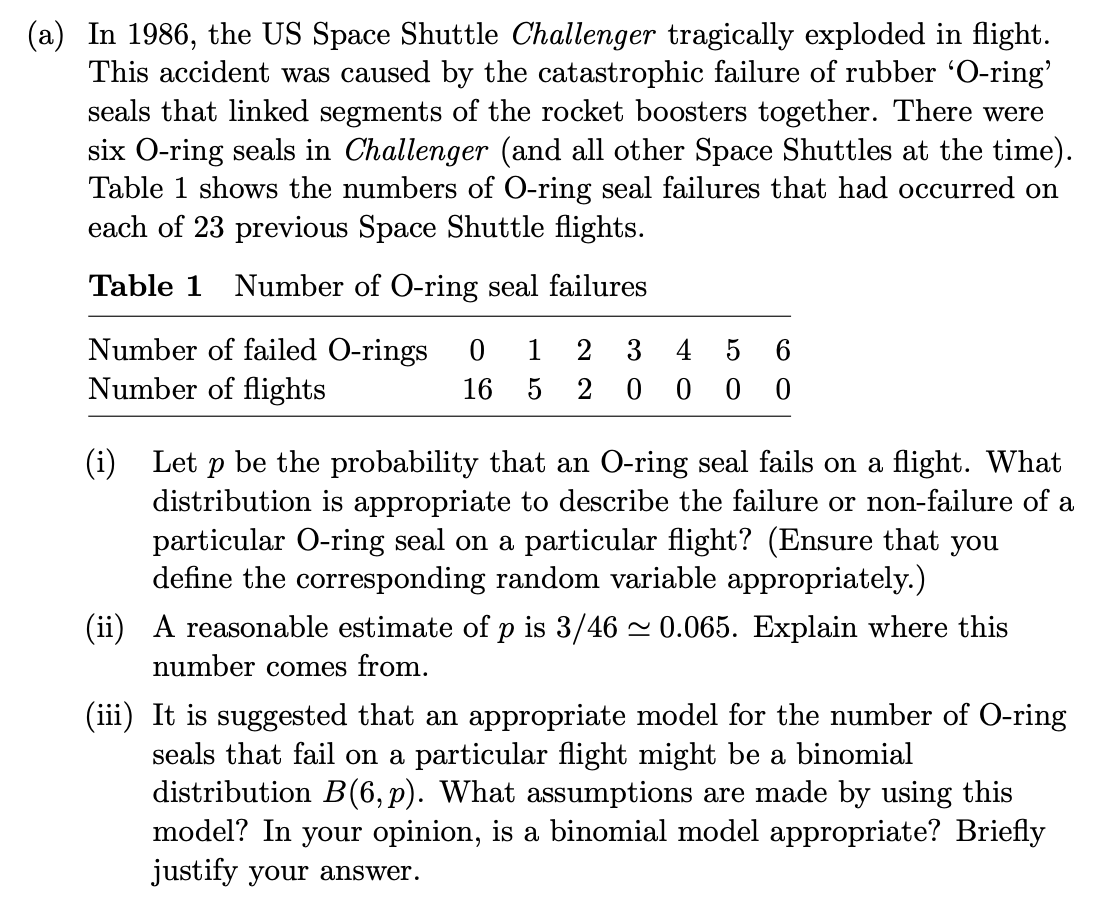
Transcribed Image Text:(a) In 1986, the US Space Shuttle Challenger tragically exploded in flight.
This accident was caused by the catastrophic failure of rubber 'O-ring'
seals that linked segments of the rocket boosters together. There were
six O-ring seals in Challenger (and all other Space Shuttles at the time).
Table 1 shows the numbers of O-ring seal failures that had occurred on
each of 23 previous Space Shuttle flights.
Table 1 Number of O-ring seal failures
Number of failed O-rings
Number of flights
1
2
3
4
5
6
16
0 0
(i) Let p be the probability that an O-ring seal fails on a flight. What
distribution is appropriate to describe the failure or non-failure of a
particular O-ring seal on a particular flight? (Ensure that you
define the corresponding random variable appropriately.)
(ii) A reasonable estimate of p is 3/46 - 0.065. Explain where this
number comes from.
(iii) It is suggested that an appropriate model for the number of O-ring
seals that fail on a particular flight might be a binomial
distribution B(6, p). What assumptions are made by using this
model? In your opinion, is a binomial model appropriate? Briefly
justify your answer.
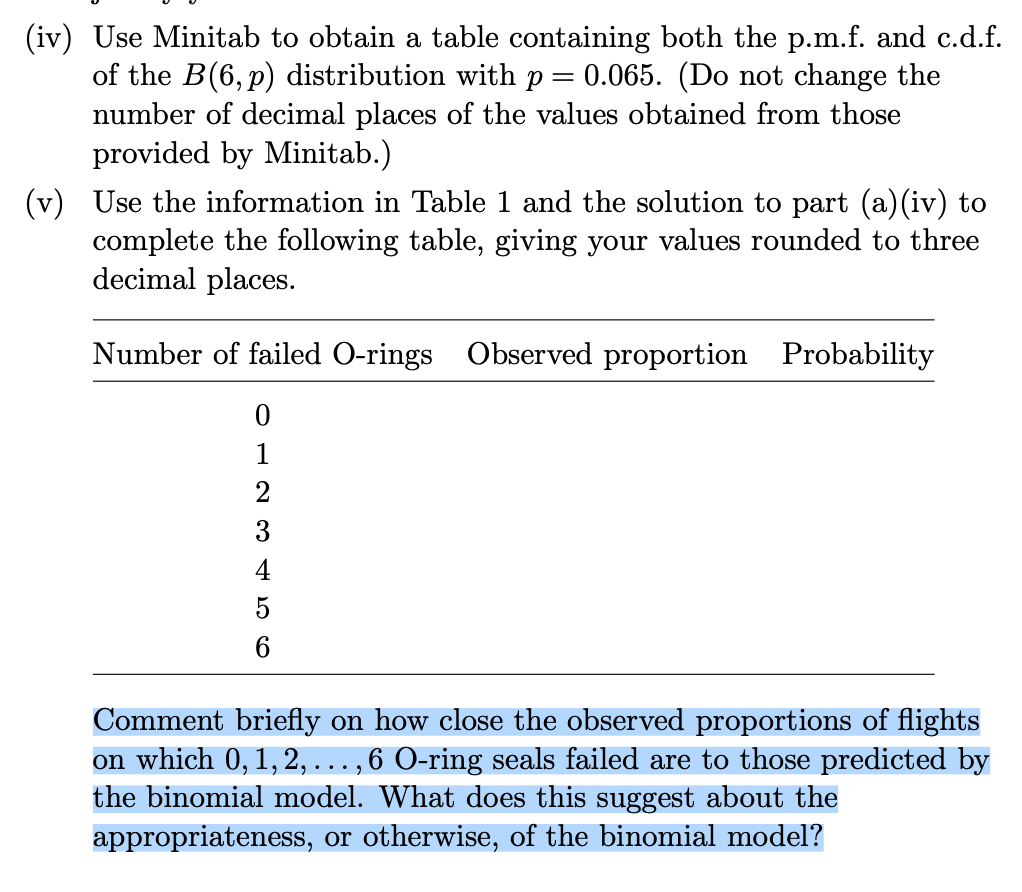
Transcribed Image Text:(iv) Use Minitab to obtain a table containing both the p.m.f. and c.d.f.
of the B(6, p) distribution with p = 0.065. (Do not change the
number of decimal places of the values obtained from those
provided by Minitab.)
(v) Use the information in Table 1 and the solution to part (a)(iv) to
complete the following table, giving your values rounded to three
decimal places.
Number of failed O-rings
Observed proportion Probability
1
2
3
4
5
6.
Comment briefly on how close the observed proportions of flights
on which 0, 1,2, . . . , 6 O-ring seals failed are to those predicted by
the binomial model. What does this suggest about the
appropriateness, or otherwise, of the binomial model?
Expert Solution
This question has been solved!
Explore an expertly crafted, step-by-step solution for a thorough understanding of key concepts.

Step by step
Solved in 3 steps with 1 images

Recommended textbooks for you
MATLAB: An Introduction with Applications
Statistics
ISBN:
9781119256830
Author:
Amos Gilat
Publisher:
John Wiley & Sons Inc

Probability and Statistics for Engineering and th…
Statistics
ISBN:
9781305251809
Author:
Jay L. Devore
Publisher:
Cengage Learning

Statistics for The Behavioral Sciences (MindTap C…
Statistics
ISBN:
9781305504912
Author:
Frederick J Gravetter, Larry B. Wallnau
Publisher:
Cengage Learning
MATLAB: An Introduction with Applications
Statistics
ISBN:
9781119256830
Author:
Amos Gilat
Publisher:
John Wiley & Sons Inc
Probability and Statistics for Engineering and th…
Statistics
ISBN:
9781305251809
Author:
Jay L. Devore
Publisher:
Cengage Learning
Statistics for The Behavioral Sciences (MindTap C…
Statistics
ISBN:
9781305504912
Author:
Frederick J Gravetter, Larry B. Wallnau
Publisher:
Cengage Learning

Elementary Statistics: Picturing the World (7th E…
Statistics
ISBN:
9780134683416
Author:
Ron Larson, Betsy Farber
Publisher:
PEARSON

The Basic Practice of Statistics
Statistics
ISBN:
9781319042578
Author:
David S. Moore, William I. Notz, Michael A. Fligner
Publisher:
W. H. Freeman

Introduction to the Practice of Statistics
Statistics
ISBN:
9781319013387
Author:
David S. Moore, George P. McCabe, Bruce A. Craig
Publisher:
W. H. Freeman