
MATLAB: An Introduction with Applications
6th Edition
ISBN: 9781119256830
Author: Amos Gilat
Publisher: John Wiley & Sons Inc
expand_more
expand_more
format_list_bulleted
Related questions
Concept explainers
Question
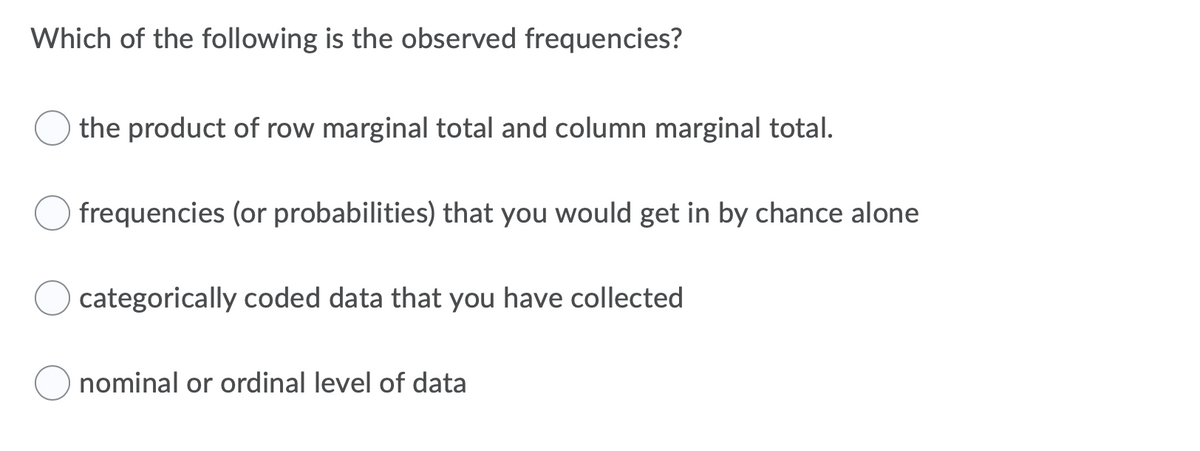

Transcribed Image Text:Which of the following is the observed frequencies?
the product of row marginal total and column marginal total.
frequencies (or probabilities) that you would get in by chance alone
categorically coded data that you have collected
nominal or ordinal level of data
Expert Solution
This question has been solved!
Explore an expertly crafted, step-by-step solution for a thorough understanding of key concepts.

This is a popular solution

Trending nowThis is a popular solution!

Step by stepSolved in 2 steps

Knowledge Booster


Learn more about
Need a deep-dive on the concept behind this application? Look no further. Learn more about this topic, statistics and related others by exploring similar questions and additional content below.Similar questions
- When data is said to be binomial, this means that ___________. a. They will always be normally distributed b. There are only 2 sets of data c. There are only 2 categories in which a measurement could possibly belong d. The data is classified into 2 or more categoriesarrow_forwardThe durations (minutes) of 26 electric power outages in the community of Sonando Heights over the past five years are shown below. 38 48 22 69 24 15 53 14 48 1 13 42 42 99 30 18 12 53 19 2 17 26 93 25 16 20 Click here for the Excel Data File (a) Find the mean, median, and mode. (Round your answers to 2 decimal places.) Descriptive Statistics Data Mean Median Mode (b) Are the mean and median about the same? (Click to select) Yes No , the mean is (Click to select) greater than less than the median. (c) Is the mode a good measure of center for this data set? Yes No (d) Is the distribution skewed? Yes, the distribution is skewed left. No, the distribution is symmetric. Yes, the distribution is skewed right.arrow_forwardTextbook: Statistics for the Behavioral SciencesGregory J. Privitera Please show your work-Concept and Application Problems (Pg.133) State whether each of the following will increase, decrease, or have no effect on the population variance. The sum of squares (SS) increases. The sample size decreases. The size of the population increases.arrow_forward
- Do question 2arrow_forwardStatistic Characteristic: The median is not affected by unusual values (e.g. outliers). As such, it is referred to as a __________ statistic. A. Resilient B. Resistant C. Recurring D. Reticent E. Repicating F. Reliant G. Redundant H. Regressivearrow_forwardPlease help this is class workarrow_forward
- Find the mean, the median, and all modes for the data in the given frequency distribution. (Round your answers to one decimal place. If there is more than one mode, enter your answer as a comma-separated list. If an answer does not exist, enter DNE.) mean median mode(s) Points Scored by Lynn Points scored in abasketball game Frequency 2 8 8 5 9 8 13 4 14 1 18 3 21 1arrow_forwardThe table shows population statistics for the ages of Best Actor and Best Supporting Actor winners at an awards ceremony The distributions of the ages are approximately bell-shaped. Compare the z-scores for the actors in the following situation. Best Actor Best Supporting Actor H= 51.0 H = 43.0 6 = 6.9 0 = 16 In a particular year, the Best Actor was 50 years old and the Best Supporting Actor was 47 years old. Determine the z-scores for each. Best Actor: z = Best Supporting Actor: z = (Round to two decimal places as needed.) Clear All Check Answer Help Me Solve This View an Example Get More Help - 10:22 PM P Type here to search 68°F Cloudy ^ 24 88 10/7/2021 10.0517 Esc FI C F5 F2 F3 F4 F6 F7 F8 PrtSc Insert Delete F9 F10 F11 F12 C@ 3 6 80 Backspace Num Lock T Y U P 7 Home PaUp S D G +II HI 5 LL LUarrow_forward
arrow_back_ios
arrow_forward_ios
Recommended textbooks for you
- MATLAB: An Introduction with ApplicationsStatisticsISBN:9781119256830Author:Amos GilatPublisher:John Wiley & Sons Inc
 Probability and Statistics for Engineering and th...StatisticsISBN:9781305251809Author:Jay L. DevorePublisher:Cengage Learning
 Statistics for The Behavioral Sciences (MindTap C...StatisticsISBN:9781305504912Author:Frederick J Gravetter, Larry B. WallnauPublisher:Cengage Learning
  Elementary Statistics: Picturing the World (7th E...StatisticsISBN:9780134683416Author:Ron Larson, Betsy FarberPublisher:PEARSON
 The Basic Practice of StatisticsStatisticsISBN:9781319042578Author:David S. Moore, William I. Notz, Michael A. FlignerPublisher:W. H. Freeman
 Introduction to the Practice of StatisticsStatisticsISBN:9781319013387Author:David S. Moore, George P. McCabe, Bruce A. CraigPublisher:W. H. Freeman
MATLAB: An Introduction with Applications
Statistics
ISBN:9781119256830
Author:Amos Gilat
Publisher:John Wiley & Sons Inc
Probability and Statistics for Engineering and th...
Statistics
ISBN:9781305251809
Author:Jay L. Devore
Publisher:Cengage Learning
Statistics for The Behavioral Sciences (MindTap C...
Statistics
ISBN:9781305504912
Author:Frederick J Gravetter, Larry B. Wallnau
Publisher:Cengage Learning
Elementary Statistics: Picturing the World (7th E...
Statistics
ISBN:9780134683416
Author:Ron Larson, Betsy Farber
Publisher:PEARSON
The Basic Practice of Statistics
Statistics
ISBN:9781319042578
Author:David S. Moore, William I. Notz, Michael A. Fligner
Publisher:W. H. Freeman
Introduction to the Practice of Statistics
Statistics
ISBN:9781319013387
Author:David S. Moore, George P. McCabe, Bruce A. Craig
Publisher:W. H. Freeman