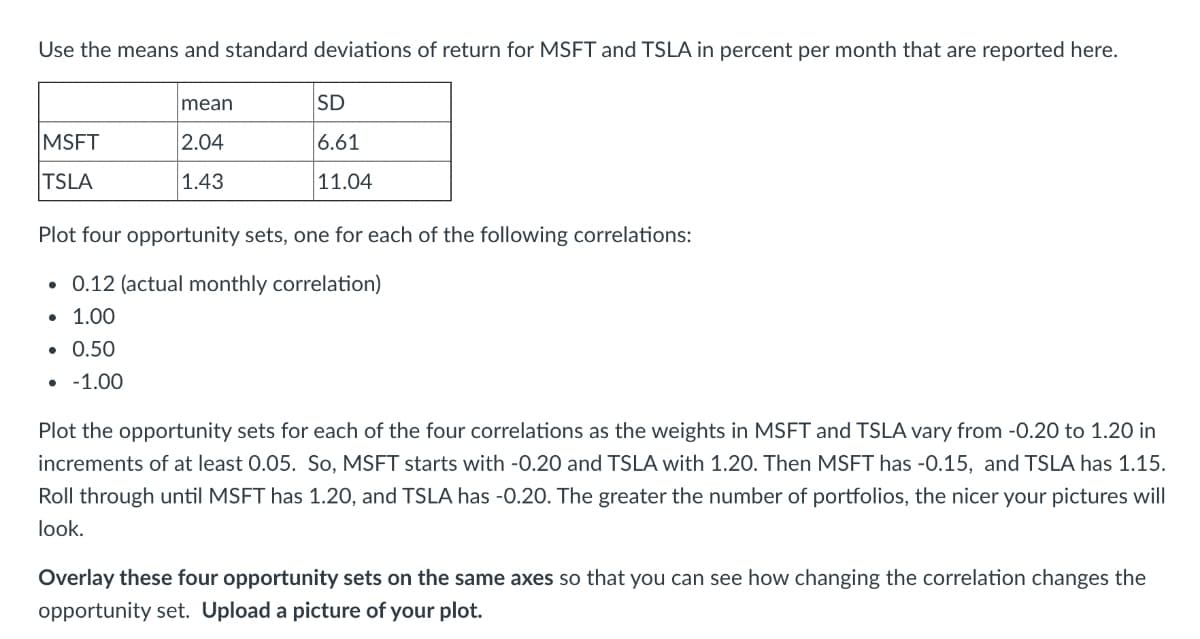
Use the means and standard deviations of return for MSFT and TSLA in percent per month that are reported here. mean SD MSFT 2.04 6.61 TSLA 1.43 11.04 Plot four opportunity sets, one for each of the following correlations: • 0.12 (actual monthly correlation) • 1.00 • 0.50 • -1.00 Plot the opportunity sets for each of the four correlations as the weights in MSFT and TSLA vary from -0.20 to 1.20 in increments of at least 0.05. So, MSFT starts with -0.20 and TSLA with 1.20. Then MSFT has -0.15, and TSLA has 1.15. Roll through until MSFT has 1.20, and TSLA has -0.20. The greater the number of portfolios, the nicer your pictures will look. Overlay these four opportunity sets on the same axes so that you can see how changing the correlation changes the opportunity set. Upload a picture of your plot.
Use the means and standard deviations of return for MSFT and TSLA in percent per month that are reported here. mean SD MSFT 2.04 6.61 TSLA 1.43 11.04 Plot four opportunity sets, one for each of the following correlations: • 0.12 (actual monthly correlation) • 1.00 • 0.50 • -1.00 Plot the opportunity sets for each of the four correlations as the weights in MSFT and TSLA vary from -0.20 to 1.20 in increments of at least 0.05. So, MSFT starts with -0.20 and TSLA with 1.20. Then MSFT has -0.15, and TSLA has 1.15. Roll through until MSFT has 1.20, and TSLA has -0.20. The greater the number of portfolios, the nicer your pictures will look. Overlay these four opportunity sets on the same axes so that you can see how changing the correlation changes the opportunity set. Upload a picture of your plot.

Essentials of Business Analytics (MindTap Course List)
2nd Edition
ISBN:9781305627734
Author:Jeffrey D. Camm, James J. Cochran, Michael J. Fry, Jeffrey W. Ohlmann, David R. Anderson
Publisher:Jeffrey D. Camm, James J. Cochran, Michael J. Fry, Jeffrey W. Ohlmann, David R. Anderson
Chapter8: Time Series Analysis And_forecasting
Section: Chapter Questions
Problem 11P: For the Hawkins Company, the monthly percentages of all shipments received on time over the past 12...

Related questions
Question
Transcribed Image Text:Use the means and standard deviations of return for MSFT and TSLA in percent per month that are reported here.
mean
SD
MSFT
2.04
6.61
TSLA
1.43
11.04
Plot four opportunity sets, one for each of the following correlations:
0.12 (actual monthly correlation)
• 1.00
• 0.50
• -1.00
Plot the opportunity sets for each of the four correlations as the weights in MSFT and TSLA vary from -0.20 to 1.20 in
increments of at least 0.05. So, MSFT starts with -0.20 and TSLA with 1.20. Then MSFT has -0.15, and TSLA has 1.15.
Roll through until MSFT has 1.20, and TSLA has -0.20. The greater the number of portfolios, the nicer your pictures will
look.
Overlay these four opportunity sets on the same axes so that you can see how changing the correlation changes the
opportunity set. Upload a picture of your plot.
Expert Solution
This question has been solved!
Explore an expertly crafted, step-by-step solution for a thorough understanding of key concepts.

This is a popular solution!

Trending now
This is a popular solution!

Step by step
Solved in 2 steps with 3 images

Knowledge Booster


Learn more about
Need a deep-dive on the concept behind this application? Look no further. Learn more about this topic, finance and related others by exploring similar questions and additional content below.Recommended textbooks for you
Essentials of Business Analytics (MindTap Course …
Statistics
ISBN:
9781305627734
Author:
Jeffrey D. Camm, James J. Cochran, Michael J. Fry, Jeffrey W. Ohlmann, David R. Anderson
Publisher:
Cengage Learning
Essentials of Business Analytics (MindTap Course …
Statistics
ISBN:
9781305627734
Author:
Jeffrey D. Camm, James J. Cochran, Michael J. Fry, Jeffrey W. Ohlmann, David R. Anderson
Publisher:
Cengage Learning