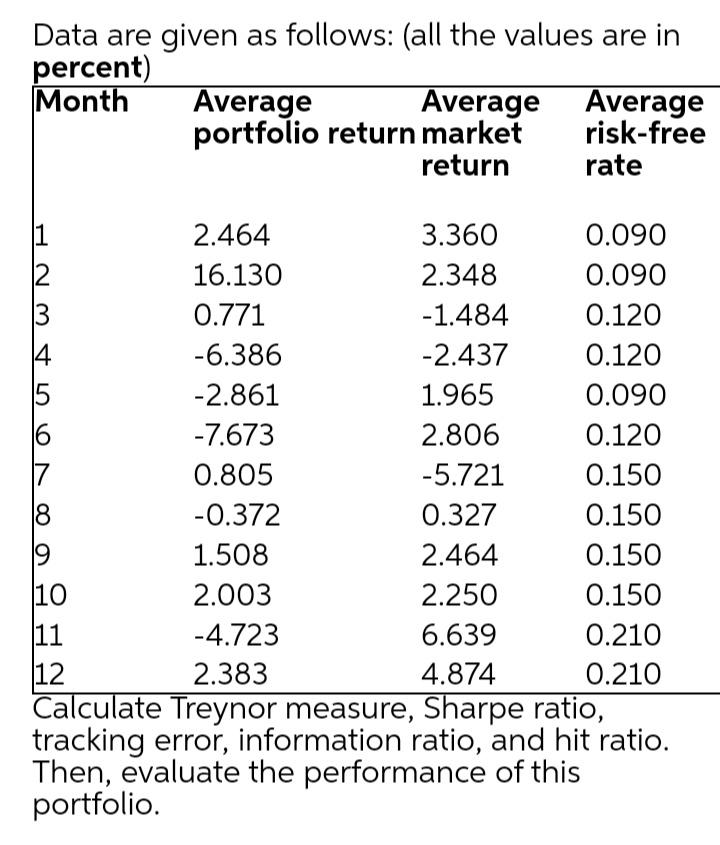
Data are given as follows: (all the values are in percent) Month Average portfolio return market Average Average risk-free rate return 2.464 3.360 0.090 2 16.130 2.348 0.090 0.771 -1.484 0.120 -6.386 -2.437 0.120 15 -2.861 1.965 0.090 6 7 -7.673 2.806 0.120 0.805 -5.721 0.150 -0.372 0.327 0.150 1.508 2.464 0.150 10 11 12 Calculate Treynor measure, Sharpe ratio, tracking error, information ratio, and hit ratio. Then, evaluate the performance of this portfolio. 2.003 2.250 0.150 -4.723 6.639 0.210 2.383 4.874 0.210
Q: Consider historical data showing that the average annual rate of return on the S&P 500 portfolio…
A: Return on portfolio E(r) = Wbills*Rbills + Windex*Rindex Rindex = Rbills+risk premium As treasury…
Q: Using the information below to calculate the following monthly returns for the portfolio.…
A: Return is a rate at which investment grows in different periods.
Q: ) An analyst wants to evaluate portfolio X, using both the Treynor and Sharpe measures of portfolio…
A: Part (c) has been solved. Portfolio’s M2 is the excess return earned by adjusting the portfolio and…
Q: Angela’s portfolio holds security A, which returned 12.0%, security B, which returned 15.0% and…
A: expected return of portfolio =wA×rA+wB×rB+wC×rCwhere,w=weights of respective stocksr= return of…
Q: Your portfolio has provided you with returns of 8.6 percent, 14.2 percent, -3.7 percent, and 12.0…
A: Geometric average return is a very useful tool which is used by investors to calculate the rate of…
Q: A portfolio consists of $15 million of asset A (for which annual expected return is 10% and annual…
A: Volatility of returns of a portfolio containing three assets Volatility is measured in terms of…
Q: James Peterson has gathered the following information of 5 exchange-traded funds (ETFS). The…
A: Since you have posted a question with multiple sub-parts, we will solve first three subparts for…
Q: A portfolio has an expected annual return of 12.2% and a standard deviation of 18.2%. What is the…
A: Given Information: Annual expected return = 12.2% Annual standard deviation = 18.2%
Q: Following is forecast for economic situation and Rachel’s portfolio returns next year, calculate the…
A: Probability Return on stock Mild recession 0.35 -5.00% Growth 0.45 15.00% Strong growth 0.2…
Q: price
A: Formula to calculate bond price is: P = C* 1 - (1+r)^-n + F/(1+r)^n r Where C…
Q: a. What is the rate of return on the portfolio in each scenario? (Enter your answer as a percent…
A: Expected return refers to the investor’s predicted amount of profit and loss on an investment.…
Q: (CAPM and expected returns) a. Given the following holding-period returns, LOADING... Month…
A:
Q: A portfolio returned 11% last year, 2% better than the market return of 9%. the portfolio’s return…
A: Sharpe ratio = (Mean portfolio return − Risk-free rate)/Standard deviation of portfolio return
Q: What is the expected return for the following portfolio? (State your answer in percent with two…
A: The question is related to Expected Return of Portfolio. The expected return of Portfolio is…
Q: Angela’s portfolio holds security A, which returned 12.0%, security B, which returned 15.0% and…
A: Return on A = 12% Return on B = 15% Return on C = -5% Weight of A = 45% Weight of B = 25% Weight…
Q: A portfolio manager creates the following portfolio: Assets Expected Annual Return % Annual Standard…
A: Given:
Q: Consider the following bootstrapped 3-year performance of an actively managed investor's portfolio…
A: Tracking error means identifying the difference between the actual and benchmark position of the…
Q: If the T Bill rate is 1.1% and the market risk premium is 10.8%, what is the CAPM-implied expected…
A: Portfolio is a bunch of various assets or investments. Investors invest their funds in various…
Q: 2. Compute the average and standard deviation of monthly rate of return of the portfolio Month RATE…
A: Solution:- Average return means the simple average of the given returns. So, simple average =…
Q: In a perfect world where asset return is normally distributed. We have risk and return…
A: The expected return on a portfolio is the weighted average of the expected return s of the…
Q: In a perfect world where asset return is normally distributed. We have risk and return…
A: Here, Assets ABC DEF Market portfolio Expected Return 10% 15% 5% Standard Deviation 20% 40%…
Q: Given the following information, what is the expected return on a portfolio that is invested 30…
A: A combination of different types of securities for the investment is term as the portfolio.
Q: James Peterson has gathered the following information of 5 exchange-traded funds (ETFS). The…
A: total return =p2+dp1-1 where, p2= price at year 2 p1 = price at year 1 d= dividend therefore,…
Q: The market portfolio's historical returns for the past three years were 10 percent, 10 percent, and…
A: Average market return = Sum of returns / number of returns Risk free rate of return = 0.04…
Q: Portfolio Standard deviation of What happens to the portfolio risk if market conditions reduce the…
A: Given: Return on A = 12% Return on B = 15% Return on C = -5% Weight of A = 45% Weight of B = 25%…
Q: Required: Calculate the: Cal Bank has a corporate bond that matures in two years but makes…
A: Required in question: Cal Bank has a corporate bond that matures in two years but makes semi-annual…
Q: Using the data in the table, consider a portfolio that maintains a 35% weight on stock A and a 65%…
A: Given: Weight 35% 65% Year Stock A Stock B 2010 -3% 21% 2011 8% 24% 2012 7% 28% 2013…
Q: State of Economy Probability ABC Company Expected Return Expected Return XYZ Company Very Poor 0.30…
A: Solution : Co-Variance is calculated as follows. Co-Variance : Dx * Dy / N…
Q: Refer the table below on the average excess return of the U.S. equity market and the standard…
A: The question is based on the concept of portfolio theory and management. The portfolio is a…
Q: What is the standard deviation of the returns of a portfolio that produced returns of -14%, 30%, and…
A: Standard Deviation is the square root of the Square of Deviation from the mean return divided by the…
Q: Consider the following information: Rate of Return if State Occurs Probability of State of Economy…
A: Answer a:-The following table shows the portfolio return under each state of the economy. The…
Q: Your portfolio has provided you with returns of 8.6 percent, 14.2 percent, -3.7 percent, and 12.0…
A: The rate of return that an investor is earning from a particular investment in a particular time…
Q: If your portfolio has provided you with returns of 9.7%, -6.2%, 12.1%, 11.5% and 13.3% over the past…
A: Geometric average return = [(1+return1)*(1+return2)*(1+return3)*(1+return4)*(1+return5) ^ 1/5] -1
Q: a. Calculate the expected portfolio return, rp, for each of the 6 years. b. Calculate the expected…
A: “Since you have posted a question with multiple subparts, we will solve first three subparts for…
Q: Below are the annual returns provided by TSCM. Calculate average annual return experienced by an…
A:
Q: You have observed the following returns over time: Stock X…
A: Formulas:
Q: The table below contains records of rates of return for a mutual fund F and for the market portfolio…
A:
Q: onsider the case of two financial assets and three market conditions (states). The table below gives…
A: Expected rate of the portfolio depends on the weight of stocks in portfolio and return on stocks of…
Q: An investment portfolio has equal proportions invested in five stocks. The expected returns and…
A: Investment portfolio : No. of stocks : 5 Weights : equal or 100%/5 = 20% or 0.2 for each stock…
Q: I. 1. Consider stocks A and B with the following past returns: Month 1 2 3 4 A 4% 6% 8% 2% В 10% 8%…
A: Hi There, Thanks for posting the questions. As per our Q&A guidelines, must be answered only one…
Q: Consider the following bootstrapped 3-year performance of an actively managed investor's portfolio…
A: Tracking error means identifying the difference between the actual and benchmark position of the…
Q: Consider an equal-weighted portfolio that comprises two assets: A and B. The monthly returns for…
A: To Find: X
Q: The risk-free rate is currently 8.1%. Use the data in the accompanying table for the Fio family’s…
A: Treynor's measure It measures the additional reward in terms of rate of return for per unit of risk.…
Q: portfolio had a Sharpe measure of ___
A: The risk-return ratio is known as the Sharpe Ratio. It is a measure of return generated over and…
Q: if you have the financial data for two portfolios as follows: The first portfolio of the United…
A: Risk: The possibility that the actual return from a portfolio might differ from the expected return…
Step by step
Solved in 3 steps with 2 images
- he following data represents the annual sales of a Digitech Automation products SAOG. Year 2014 2015 2016 2017 2018 Sales (in Millions) OMR 380 440 520 396 514 Use method of least squares to calculate the trend values and the forecast for the future period. Which of the following is the annual sales forecast for the year 2019 using least squares method? a. 539.6 Million OMR b. 584.4 Million OMR c. 606.8 Million OMR d. 562 Million OMRPlease fill out the parts in the above table that are shaded in yellow. You will notice that there are nine line items Please answer : Covariance with MP Correlation with Market Index Beta CAPM Req. ReturnCompute trend percents for the above accounts, using 2017 as the base year. For each of the three accounts, state whether the situation as revealed by the trend percents appears to be favorable or unfavorable. Sales $ 666,761 $ 432,962 $ 344,990 $ 249,090 $ 180,500 Cost of goods sold 329,263 213,901 172,445 124,054 88,445 Accounts receivable 32,138 25,242 23,632 14,547 12,328
- Refer to the original data. Compute the company's margin of safety in both dollar and percentage terms. (Round your percentage answer to 2 decimal places (i.e. 0.1234 should be entered as 12.34).)Computing and analyzing trend percents LO P1 2021 2020 2019 2018 2017 Sales $ 446,122 $ 293,501 $ 242,563 $ 173,880 $ 128,800 Cost of goods sold 221,100 145,365 122,206 87,101 63,112 Accounts receivable 21,592 17,140 16,664 10,137 8,784 Compute trend percents for the above accounts, using 2017 as the base year. For each of the three accounts, state whether the situation as revealed by the trend percents appears to be favorable or unfavorable.1.) On a single chart, plot the value of $1 invested in each of the five indexes over time. I.e., for all ??, plot the cumulative return series for each index: ?????? = (1 + ?��1)(1 + ?��2)...(1 + ????) What patterns do you observe? (10 points) 2.) Plot a histogram of only the Global index returns. Does the distribution look normal? (5 points) 3.) Estimate the following for each of the indices. In calculating the statistics, “monthly” can be interpreted as “not annualized”. (30 points) a. Arithmetic average of monthly returns, and annualized arithmetic return using the APR method b. Geometric average of monthly returns, and annualized geometric return using the EAR method. Why does the geometric average differ from the arithmetic average? c. Standard deviation of monthly returns, and annualized standard deviation d. Sharpe Ratio of monthly returns, and annualized Sharpe Ratio e. Skewness of monthly returns f. Kurtosis of monthly returns g. 5% Value at Risk (VaR) of…
- Please use the attached images as well... Compute the following: For fiscal 2019 and 2020: Current Ratio, Quick Ratio, Long Term Debt Ratio For fiscal 2019 and 2020: Gross Profit Margin, Net Profit Margin, EBITDA For fiscal 2019 and 2020: Return on Assets, Return on Equity, Return on Sales For fiscal 2020: Free Cash Flow to Equity Market Capitalization, Market to Book Value and the Price-Earnings Ratio as of year-end 2020 Stock Prices in 2018 = $68.98 2019 = $84.15 2020 = $107.82If Year 1 sales equal $830, Year 2 sales equal $913, and Year 3 sales equal $1130, the percentage to be assigned for Year 2 in a trend analysis, assuming that Year 1 is the base year, is 110%. 136%. 91%. 124%. eTextbook and MediaUsing the following selected items from the comparative balance sheet of Oriole Products.Determine the horizontal analysis. (Round percentages to 2 decimal places, e.g. 12.21%. Enter negative amounts using either a negative sign preceding the number e.g. -45 or parentheses e.g. (45).) ORIOLEPRODUCTSComparative Balance SheetDecember 31 2014 2013 Horizontal analysis Amount Percentage Amount Percentage Current assets $110,880 enter percentages % $128,216 enter percentages % Long-term assets 174,240 enter percentages % 117,304 enter percentages % Total assets 3,168,000 enter percentages % 2,728,000 enter percentages % Determine the vertical analysis. (Round percentages to 1 decimal place, e.g. 12.2%.) ORIOLEPRODUCTSComparative Balance SheetDecember 31 2014 2013 Vertical analysis Amount Percentage Amount Percentage Current assets $110,880…
- Calculate the following ratios for 2021 using working Excel formulas. Make sure to label each appropriately using the following cell (number of days, number of times, etc.) Round each answer to 2 decimal places (example: ROE of .1678 should display as 16.78%): Current Ratio Quick Ratio Debt to Equity Ratio Equity Multiplier Times Interest Earned Dividend Yield Inventory Turnover Days’ Sales in Inventory Receivables Turnover Days’ Sales in Receivables Total Asset Turnover Profit Margin Return on Assets Return on Equity P/E Ratio 2.Calculate Return on Equity (ROE) for 2021 using the DupontComplete the comparative income statement and balance sheet for Logic Company. Note: Input all answers as positive values except decrease answers which should be indicated by a minus sign. Round your "percent" answers to the nearest hundredth percent.Accessibility tab summary: Given information for this question is presented in rows 2 through 10. Requirement information is presented in rows 12 through 20. Market Data Return Standard Deviation Beta Market Data 0.120 0.200 1.000 Risk-Free Rate 0.025 0.000 0.000 Company Data A B C Alpha 0.015 0.020 -0.005 Beta 1.200 0.800 1.250 Residual standard deviation, σ(e) 0.105 0.195 0.067 Standard Deviation of Excess Return 0.245 0.235 0.210 Required: Using the data above, please solve for the Sharpe Ratio, Treynor's Measure, and Information Ratio. (Use cells A3 to D10 from the given information to complete this question. Negative answers should be input and displayed as a negative values. All other answers should be input and displayed as positive values.) Risk-Adjusted Performance Measures A B C Market Sharpe Ratio Treynor's…