Use the probability distribution to complete parts (a) and (b) below. The number of school-related extracurricular activities per student 1. Activities 2 3 4 5 6 7 Probability 0.059 0.123 0.162 0.177 0.216 0.127 0.084 0.052 (a) Find the mean, variance, and standard deviation of the probability distribution. The mean is (Round to one decimal place as needed.) The variance is (Round to one decimal place as needed.) The standard deviation is. (Round to one decimal place as needed.) (b) Interpret the results. The mean is so the average student is involved in V The standard deviation is so the typical number of activities per student (Round to one decimal place as needed.) deviates from the mean by about 4 activities. does not deviate from the mean. deviates from the mean by about 2 activities. deviates from the mean by more than 4 activities.
Use the probability distribution to complete parts (a) and (b) below. The number of school-related extracurricular activities per student 1. Activities 2 3 4 5 6 7 Probability 0.059 0.123 0.162 0.177 0.216 0.127 0.084 0.052 (a) Find the mean, variance, and standard deviation of the probability distribution. The mean is (Round to one decimal place as needed.) The variance is (Round to one decimal place as needed.) The standard deviation is. (Round to one decimal place as needed.) (b) Interpret the results. The mean is so the average student is involved in V The standard deviation is so the typical number of activities per student (Round to one decimal place as needed.) deviates from the mean by about 4 activities. does not deviate from the mean. deviates from the mean by about 2 activities. deviates from the mean by more than 4 activities.

MATLAB: An Introduction with Applications
6th Edition
ISBN:9781119256830
Author:Amos Gilat
Publisher:Amos Gilat
Chapter1: Starting With Matlab
Section: Chapter Questions
Problem 1P

Related questions
Question
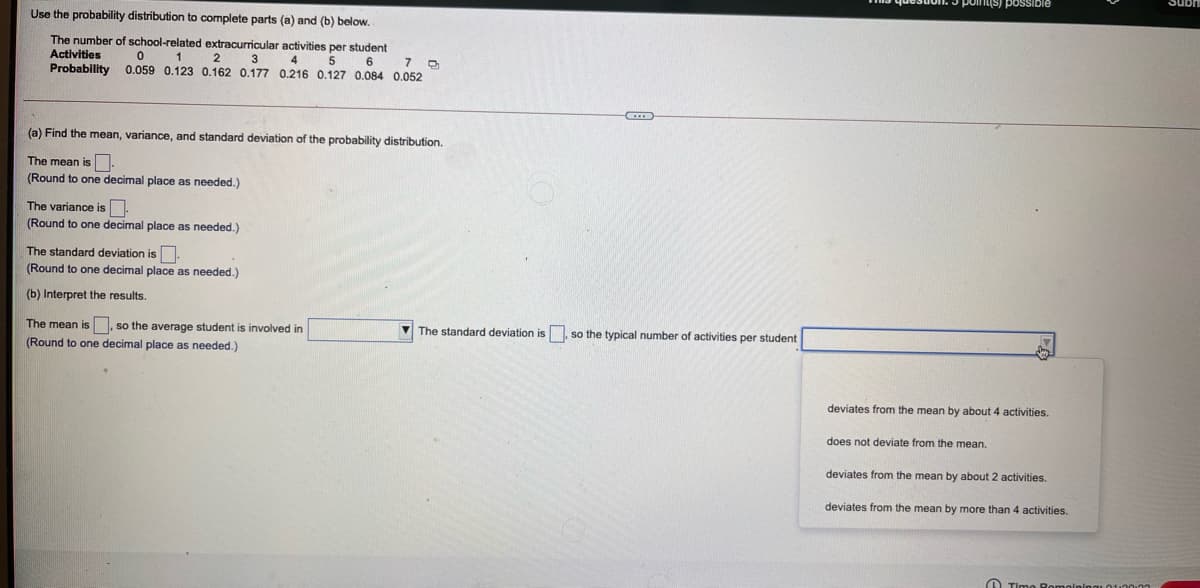
Transcribed Image Text:Use the probability distribution to complete parts (a) and (b) below.
The number of school-related extracurricular activities per student
Activities
2
3
4
5
6
Probability 0.059 0.123 0.162 0.177 0.216 0.127 0.084 0.052
(a) Find the mean, variance, and standard deviation of the probability distribution.
The mean is
(Round
one decimal place as needed.)
The variance is.
(Round to one decimal place as needed.)
The standard deviation is.
(Round
one decimal place as needed.)
(b) Interpret the results.
The mean is , so the average student
involved in
V The standard deviation is so the typical number of activities per student
(Round to one decimal place as needed.)
deviates from the mean by about 4 activities.
does not deviate from the mean.
deviates from the mean by about 2 activities.
deviates from the mean by more than 4 activities.
O Timo
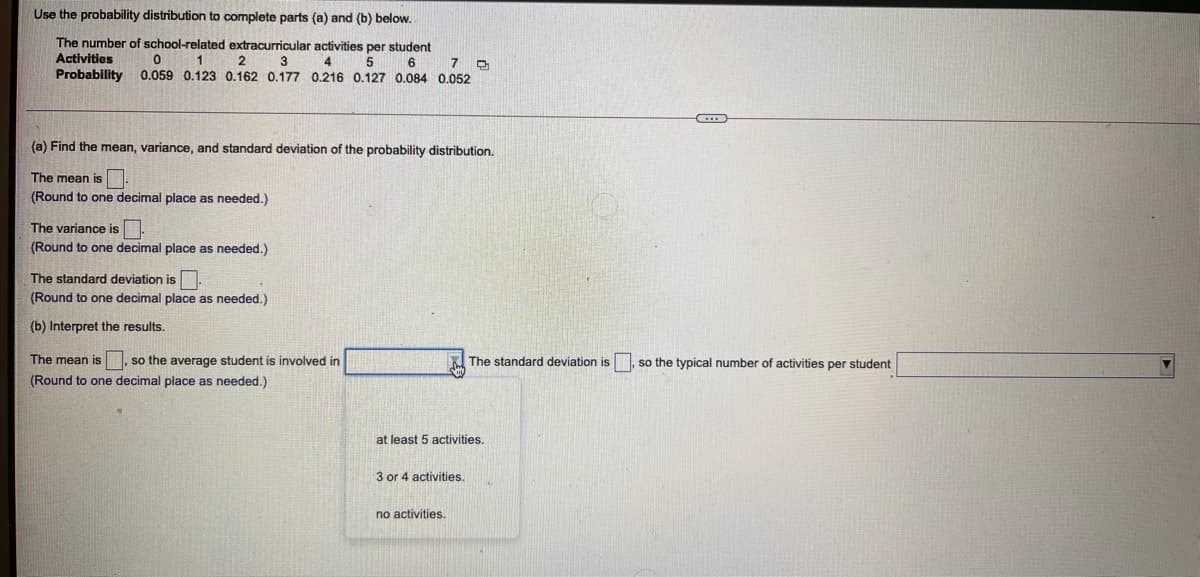
Transcribed Image Text:Use the probability distribution to complete parts (a) and (b) below.
The number of school-related extracurricular activities per student
Activities
Probability
1
2
3
4
5
7
0.059 0.123 0.162 0.177 0.216 0.127 0.084 0.052
(a) Find the mean, variance, and standard deviation of the probability distribution.
The mean is
(Round to one decimal place as needed.)
The variance is
(Round to one decimal place as needed.)
The standard deviation is
(Round to one decimal place as needed.)
(b) Interpret the results.
The mean is
so the average student is involved in
The standard deviation is , so the typical number of activities per student
(Round to one decimal place as needed.)
at least 5 activities.
3 or 4 activities.
no activities.
Expert Solution
Step 1

Step by step
Solved in 4 steps

Recommended textbooks for you
MATLAB: An Introduction with Applications
Statistics
ISBN:
9781119256830
Author:
Amos Gilat
Publisher:
John Wiley & Sons Inc

Probability and Statistics for Engineering and th…
Statistics
ISBN:
9781305251809
Author:
Jay L. Devore
Publisher:
Cengage Learning

Statistics for The Behavioral Sciences (MindTap C…
Statistics
ISBN:
9781305504912
Author:
Frederick J Gravetter, Larry B. Wallnau
Publisher:
Cengage Learning
MATLAB: An Introduction with Applications
Statistics
ISBN:
9781119256830
Author:
Amos Gilat
Publisher:
John Wiley & Sons Inc
Probability and Statistics for Engineering and th…
Statistics
ISBN:
9781305251809
Author:
Jay L. Devore
Publisher:
Cengage Learning
Statistics for The Behavioral Sciences (MindTap C…
Statistics
ISBN:
9781305504912
Author:
Frederick J Gravetter, Larry B. Wallnau
Publisher:
Cengage Learning

Elementary Statistics: Picturing the World (7th E…
Statistics
ISBN:
9780134683416
Author:
Ron Larson, Betsy Farber
Publisher:
PEARSON

The Basic Practice of Statistics
Statistics
ISBN:
9781319042578
Author:
David S. Moore, William I. Notz, Michael A. Fligner
Publisher:
W. H. Freeman

Introduction to the Practice of Statistics
Statistics
ISBN:
9781319013387
Author:
David S. Moore, George P. McCabe, Bruce A. Craig
Publisher:
W. H. Freeman